Key Highlights
- There was a minor new high in ETH price above $93.40 against the US Dollar, but with no real momentum.
- There is an important bullish trend line with support at $90.00 formed on the hourly chart (ETH/USD, data feed via SimpleFX).
- On the upside, the price needs to break $91.80 for further gains in the near term.
Ethereum price slowly moved higher against the US Dollar and Bitcoin, and now ETH/USD is trading near make-or-break levels above $90.
Ethereum Price Trend Line Support
In the last analysis, we discussed about a break above $91 in ETH price against the US Dollar. It was not easy, but there was a break above $91. The price traded above $93, and formed a new intraday high at $93.46 where it faced offers. Later, it moved down, and traded below the 23.6% Fib retracement level of the last wave from the $86.44 low to $93.46 high. The downside move was such that the price even broke the $90 support once.
However, it found support near an important bullish trend line at $90.00 formed on the hourly chart of ETH/USD. The 50% Fib retracement level of the last wave from the $86.44 low to $93.46 high also acted as a support. The price is currently consolidating above $90, and remains above the trend line. On the upside, there is connecting bearish trend line with resistance at $91.80 on the same chart.
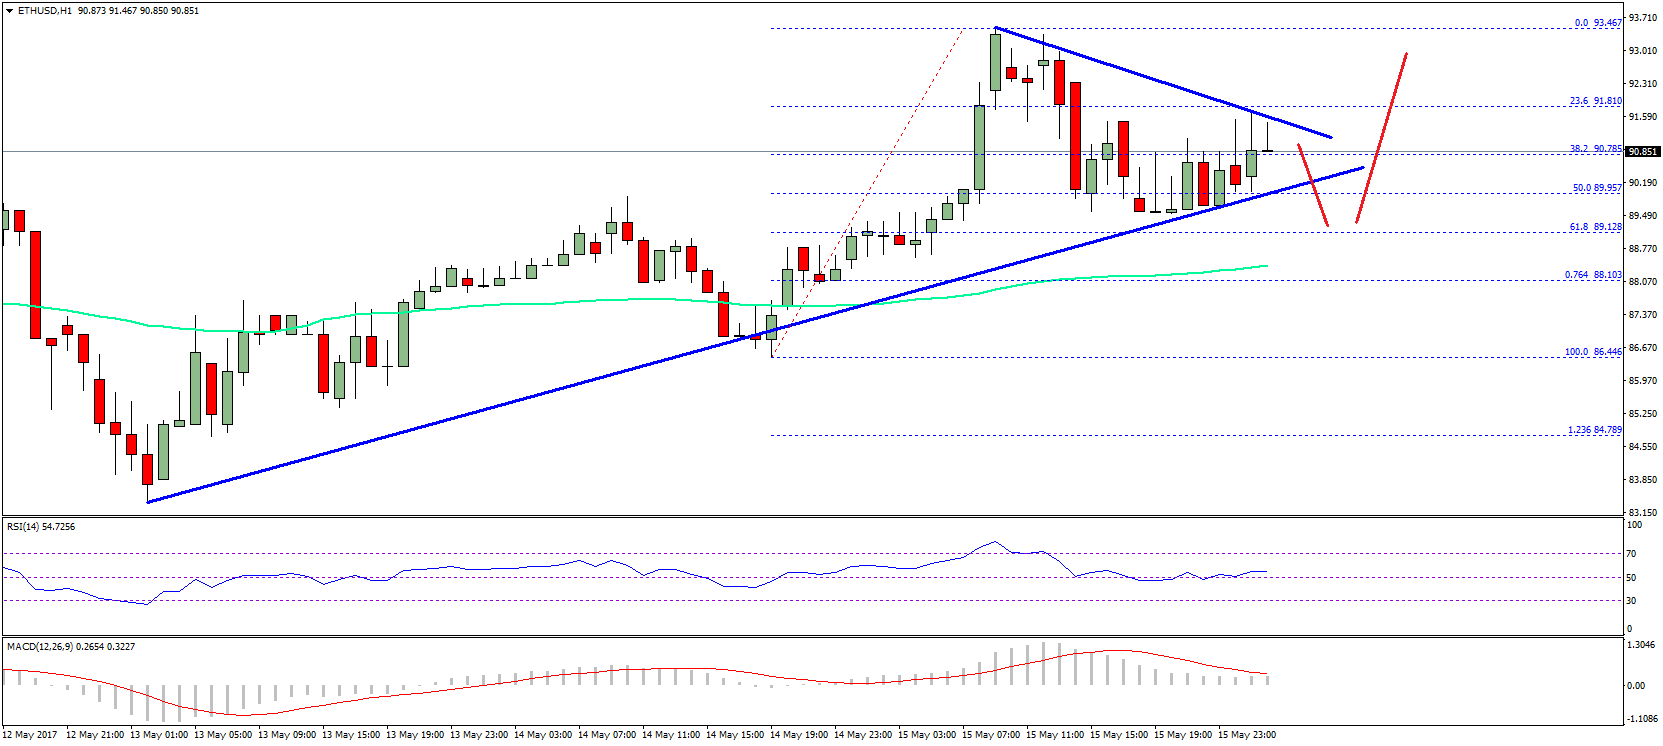
So, we can say that the price is stuck between two trend lines. It may soon either break $91.80 for further gains. Otherwise, there can be break below $90 for the downside extension. On the downside, the next major support is at $88, which coincides with the 100 hourly simple moving average.
Hourly MACD – The MACD is in the bullish zone, but with no momentum.
Hourly RSI – The RSI is moving flat above the 50 level.
Major Support Level – $90.00
Major Resistance Level – $91.80
Charts courtesy – SimpleFX