Key Highlights
- ETH price continued to face sellers against the US Dollar and Bitcoin, and likely to form a new low.
- There is a major bearish trend line formed on the hourly chart (data feed via SimpleFX) of ETH/USD, which is acting as a resistance on the upside at $7.60.
- The pair may break the recent low of $7.16 for a test of the $7.00 handle in the short term.
Ethereum price may continue to decline against the USD and BTC, and the ETH/USD pair is likely to test the $7.00 support going forward.
Ethereum Price Decline
ETH price recently attempted a correction against the US Dollar, but failed to break the $7.60 resistance area. There were a lot of offers presented around the stated level, which resulted in a decline in ETH/USD. It is also important to note that there is a major bearish trend line formed on the hourly chart (data feed via SimpleFX) of ETH/USD. It acted as a resistance near the $7.60 level and pushed the price down.
The pair declined and broke a couple of important support levels. First, the 61.8% Fib retracement level of the last wave from the $7.16 low to $7.93 high was cleared. Second, the $7.30 support zone was also broken by the ETH sellers. Overall, the pair now remains at a risk of more declines. It is already trading near the last swing low of $7.16. If the ETH sellers manage to break it, then the 1.236 extension of the last wave from the $7.16 low to $7.93 high may be tested.
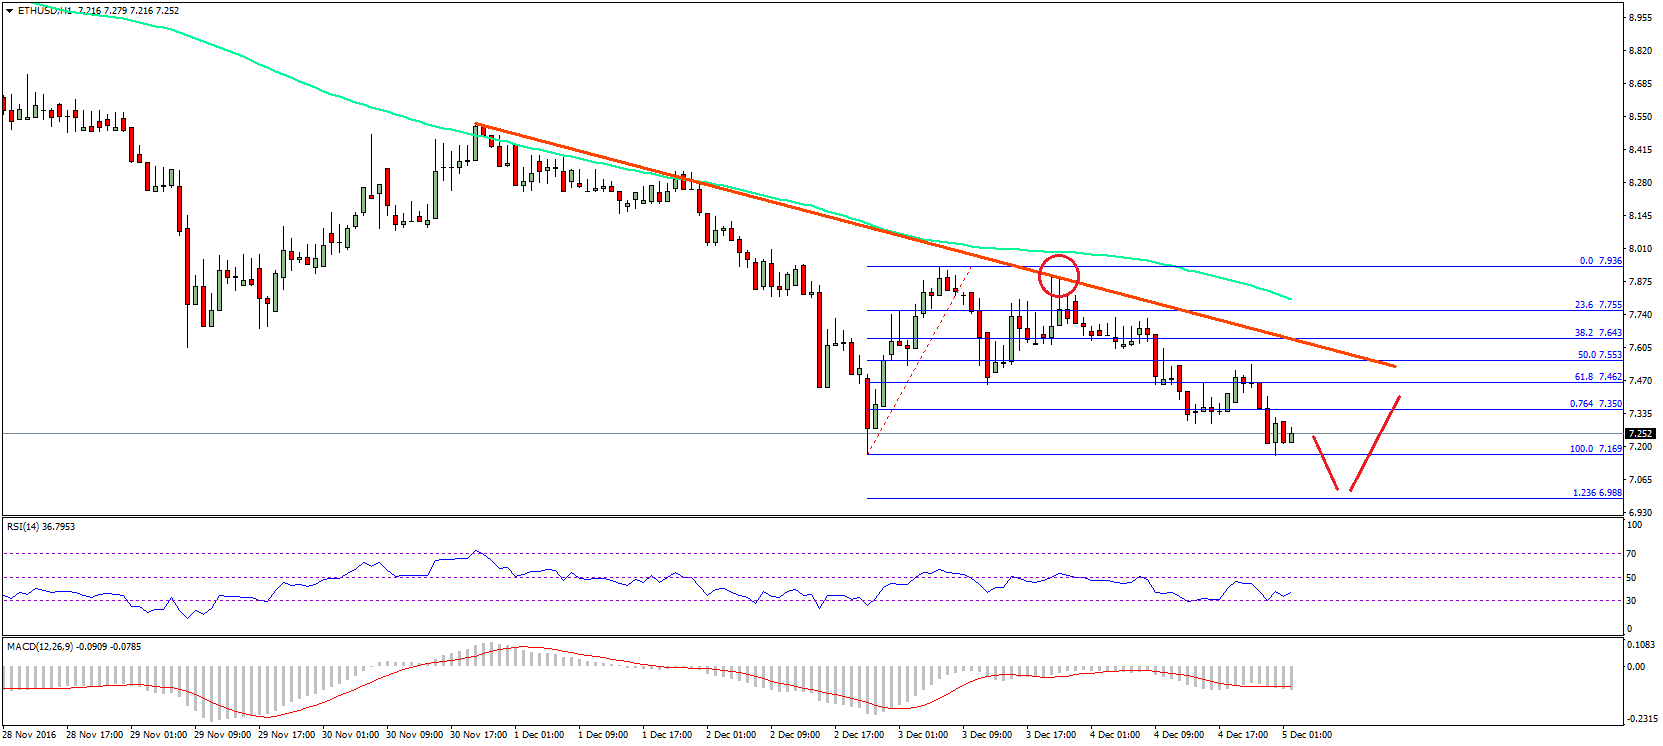
So, it looks like the price may decline further before it could find support near the $7.00 handle.
Hourly MACD – The MACD is well in the bearish zone, calling for more losses.
Hourly RSI – The RSI has reached the oversold readings, which is a bearish sign.
Major Support Level – $7.15
Major Resistance Level – $7.60
Charts courtesy – SimpleFX