Key Highlights
- There was a sharp decline in ETH price below the $88 support against the US Dollar.
- A very important bullish trend line with support at $90.00 on the hourly chart (ETH/USD, data feed via SimpleFX) was broken.
- The price is now likely heading towards the next support area at $80.95
Ethereum price nosedived against the US Dollar and Bitcoin amid XRP rise, and now ETH/USD may trade further lower towards the $80.90 zone.
Ethereum Price Major Breakdown
In the last analysis, we discussed that if there is a break below $90 in ETH price against the US Dollar, there can be an extension of losses. The price failed to hold gains and broke the $90 support. The most important move was below yesterday’s highlighted bullish trend line with support at $90.00 on the hourly chart. It opened the doors for more declines, and the price even broke the $88 support.
The downside was with strong momentum, taking the price below the 61.8% Fib retracement level of the last wave from the $83.35 low to $93.49 high. There was a sharp decline and the price even broke the $84 support. Later, there was a close below the last swing low of $83.35. This means the price may now head towards the 1.236 extension of the last wave from the $83.35 low to $93.49 high.
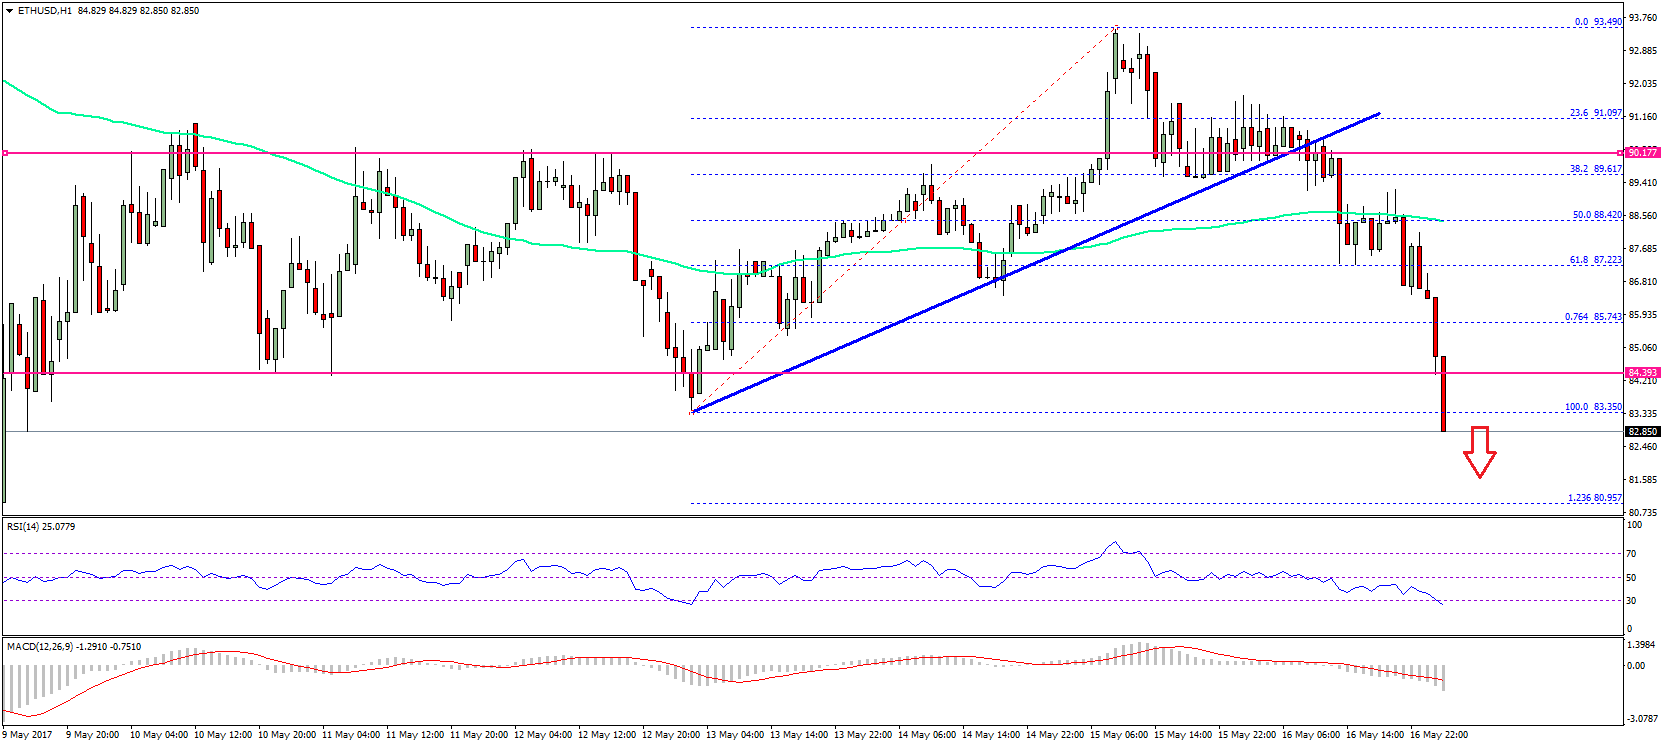
It looks like the ETH sellers are in full control, and may attempt to take the price further lower. There are even chances of ETH/USD testing $80.95 level. On the upside, the broken support at $88.42 and the 100 hourly simple moving average may now act as a resistance. There is a short-term trend change with a break below $85.
Hourly MACD – The MACD has moved sharply in the bearish zone.
Hourly RSI – The RSI is reaching oversold levels at 28.
Major Support Level – $80.95
Major Resistance Level – $88.40
Charts courtesy – SimpleFX