Key Highlights
- ETH price after a sharp downside move found support near $9.00 against the US Dollar, and started recovering.
- There was a bearish trend line formed on the hourly chart (data feed via SimpleFX) of ETH/USD, which was broken during the recent upside move.
- The price traded higher, and currently finding sellers near the $9.80-10.00 area.
Ethereum price after yesterday’s collapse found support near $9.00 against the US Dollar. The ETH/USD is now back higher and in the bullish zone.
Ethereum Price Upside Move
We saw yesterday how there was a sharp decline in ETH price against the US Dollar below the $10.00 support. The price extended its decline and moved below the last swing low of $9.40 to create a new low. There was a full test of the 1.236 extension of the last wave from the $9.40 low to $10.66 high. The price traded as low as $9.00 where it found support and started moving higher.
The price traded higher and during the upside move broke a bearish trend line formed on the hourly chart (data feed via SimpleFX) of ETH/USD. There was also a break above the 23.6% Fib retracement level of the last decline from the $10.58 high to $9.00 low. There was a solid rise, as the price moved past the $9.40 resistance area. However, the upside move found sellers near the 50% Fib retracement level of the last decline from the $10.58 high to $9.00 low.
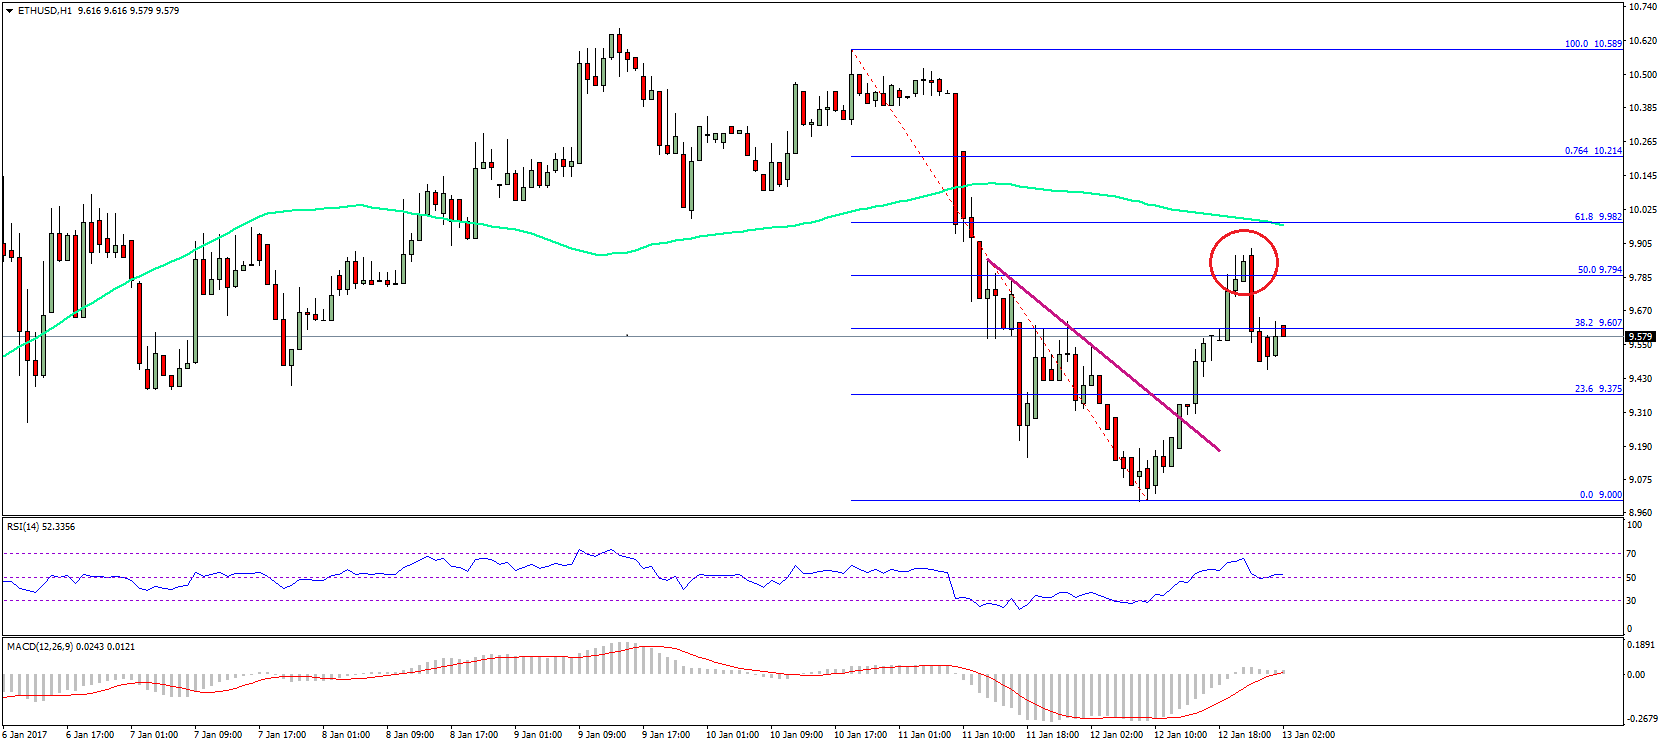
The price is currently slightly bearish below $9.80. It needs to climb above the mentioned level for the ETH buyers to step up the momentum. If there is no break, there is a chance of a retest of $9.40 at least in the near term.
Hourly MACD – The MACD is about to move into the bullish slope.
Hourly RSI – The RSI is now back above the 50 level, which is a positive sign.
Major Support Level – $9.40
Major Resistance Level – $9.80
Charts courtesy – SimpleFX