Key Highlights
- ETH price after a minor bullish wave against the US Dollar started trading in a range.
- There was a bearish trend line formed on the hourly chart (data feed via SimpleFX) of ETH/USD, which was broken recently.
- The highlighted range resistance is near $8.10 and range support is near $7.90.
Ethereum price starting trading in a range against the US Dollar, and it looks like the ETH/USD pair is preparing for the next move.
Ethereum Price Resistance
ETH price declined a few points towards the $7.85 level against the US Dollar. The price started a minor upside move, and broke a bearish trend line formed on the hourly chart (data feed via SimpleFX) of ETH/USD. There was also an upside move above the 23.6% Fib retracement level of the last decline from the $8.50 high to $7.85 low. However, the upside move was limited, as there was no real momentum.
The 100 hourly simple moving average is preventing an upside break in ETH/USD, and stopping the buyers from gaining momentum. Moreover, the 38.2% Fib retracement level of the last decline from the $8.50 high to $7.85 low is also acting as a resistance and preventing gains. It looks like a range pattern is forming with resistance is near $8.10 and support at $7.90. If the current sentiment remains intact, there is a chance of an upside break.
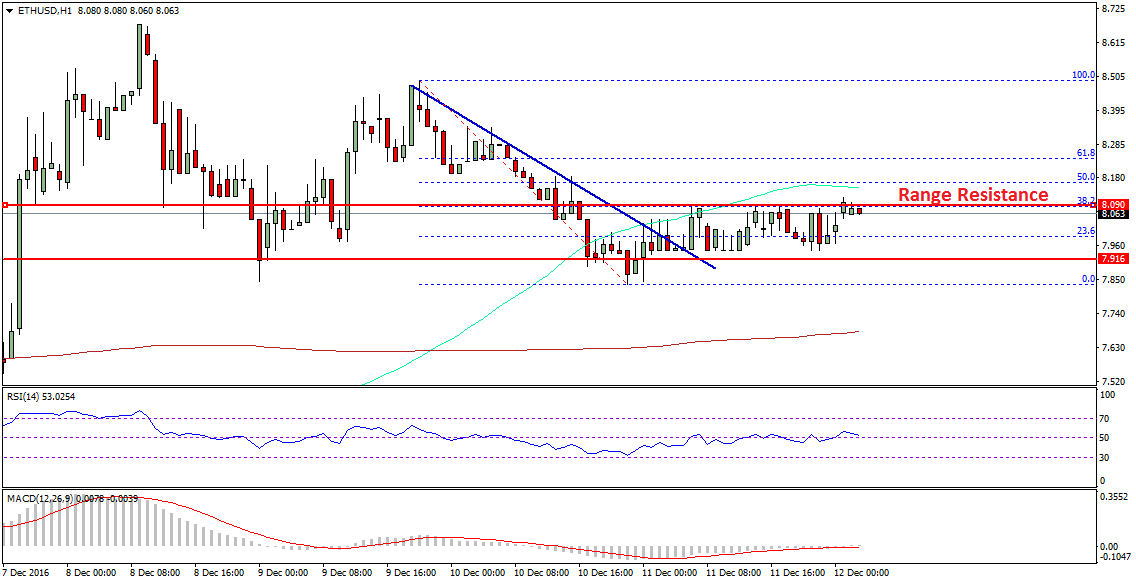
A break above the range resistance and the 100 hourly simple moving average may take the price towards $8.30. If buyers remain in control, the price may even head towards the 76.4% Fib retracement level of the last decline from the $8.50 high to $7.85 low.
Hourly MACD – The MACD is currently in the bullish zone but with no momentum.
Hourly RSI – The RSI has just moved above the 50 level, which is a positive sign.
Major Support Level – $7.90
Major Resistance Level – $8.20
Charts courtesy – SimpleFX