Key Highlights
- ETH price struggle to recover against the US Dollar and Bitcoin continued during the past 24 hours.
- There is a bearish trend line formed on the hourly chart (data feed via SimpleFX) of ETH/USD, acting as a barrier for an upside move.
- It looks like there is a range pattern formed with resistance at $9.60, and support at $9.30.
Ethereum price is currently trading in a range against the US Dollar, and once it breaks, it may ignite the next move in ETH/USD.
Ethereum Price to Decline Further?
There was no respite for ETH price over the weekend, as it remained under a bearish pressure against the US Dollar and Bitcoin. There was a slight decline in ETH/USD, and the pair almost tested the last swing low of $9.30. Looking at the charts, it looks like the pair is preparing for the next move, and currently trading in a range. There is a crucial bearish trend line formed on the hourly chart (data feed via SimpleFX) of ETH/USD.
The highlighted trend line may play a major role in the near term. There is also a range pattern with resistance at $9.60, and support at $9.30. The range resistance is near the trend line. So, it holds a lot of value, and may protect an upside move near $9.50-60. Moreover, the 23.6% Fib retracement level of the decline from the $10.04 high to $9.29 low is also just below the trend line.
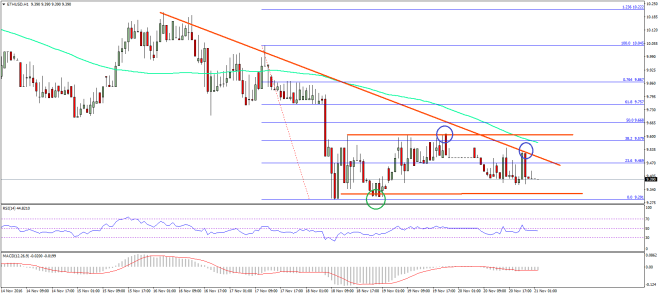

Last, the 100 hourly simple moving average is just above the trend line. So, it looks like the ETH price remains at a major risk. If the bulls fail, there can be further declines in ETH/USD.
Hourly MACD – The MACD is currently flat in the bearish zone.
Hourly RSI – The RSI is just below the 50 level but with no real momentum.
Major Support Level – $9.30
Major Resistance Level – $9.60
Charts courtesy – SimpleFX