Key Highlights
- ETH price corrected a few points recently towards $268 against the US Dollar, but recovery was limited.
- There is a descending channel with resistance at $262 forming on the hourly chart of ETH/USD (data feed via SimpleFX).
- The pair might continue to decline and move towards the $250-245 levels in the short term.
Ethereum price recovery was limited against the US Dollar and Bitcoin, and the ETH/USD pair might continue to face selling pressure below $268 in the near term.
Ethereum Price Decline
It looks like ETH price has started a slow and steady downside move from the $282 swing high against the US Dollar. The price recently traded towards $249 from where a minor recovery was initiated. The mentioned recovery took the price above the 23.6% Fib retracement level of the last decline from the $284 high to $249 low. However, the upside move was limited by a short-term resistance at $268.
There was a perfect failure near the 50% Fib retracement level of the last decline from the $284 high to $249 low. It marks a completion of the last correction from the $249 low. The 100 hourly simple moving average was also around $265-268, which prevented gains. At the moment, there is a descending channel with resistance at $262 forming on the hourly chart of ETH/USD. The channel is acting as a downside move catalyst, and might push the price back towards $248-250.
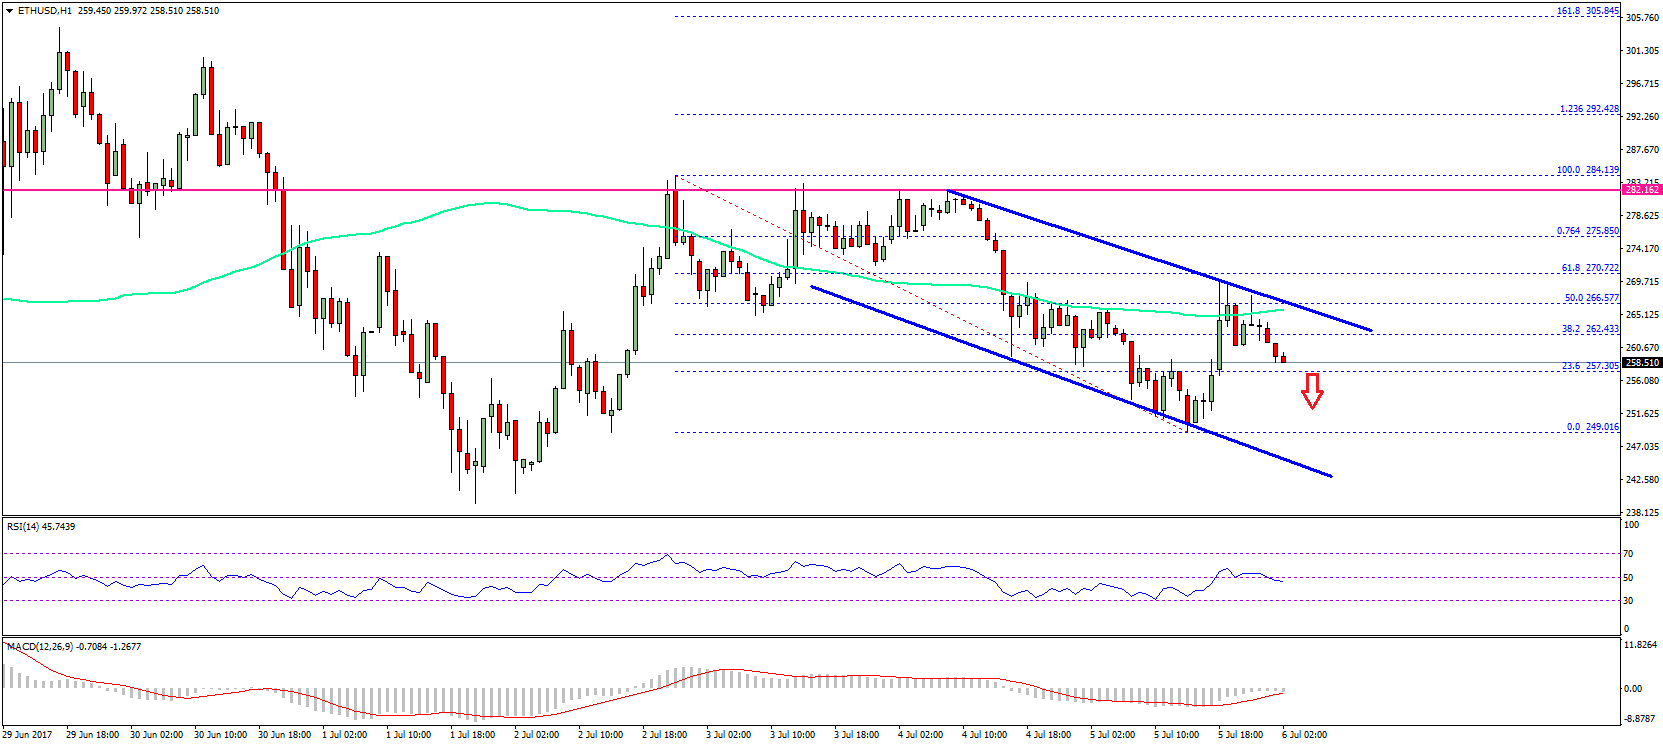
On the upside, we can continue monitoring the channel resistance at $262 and the 100 hourly simple moving average. Only a close above the 100 hourly simple moving average and $268 might decrease the current bearish pressure. On the downside, the last swing low at $249 could serve as a short-term support.
Hourly MACD – The MACD is slightly in the bearish zone.
Hourly RSI – The RSI is currently below the 50 level, but lacking momentum.
Major Support Level – $250
Major Resistance Level – $268
Charts courtesy – SimpleFX