Key Highlights
- ETH price after declining one more time against the US Dollar found support near $9.70.
- There is a tiny bearish trend line formed on the hourly chart (data feed via SimpleFX) of ETH/USD, which must be breached for an upside move.
- The price is also below the 100 hourly simple moving average, which is just below the trend line.
Ethereum price remained in a range starting yesterday against the US Dollar, and ETH/USD is waiting for a catalyst for the next move.
Ethereum Price Range
There was a recovery pattern seen in ETH price yesterday against the US Dollar and Bitcoin. However, it could not last long, as the price declined and tested the last swing low of $9.70. However, the ETH buyers managed to protect the downside move, and pushed the price back higher. The price also bounced from the 76.4% Fib retracement level of the decline from the $10.32 high to $9.44 low.
Currently, it looks like there is a range pattern formed on the hourly chart with support on the downside at $9.70, and many resistances on the way up. On the upside an initial resistance is around the 23.6% Fib retracement level of the decline from the $10.20 high to $9.70 low. However, the next one is crucial, which is in the form of a bearish trend line formed on the hourly chart (data feed via SimpleFX) of ETH/USD.
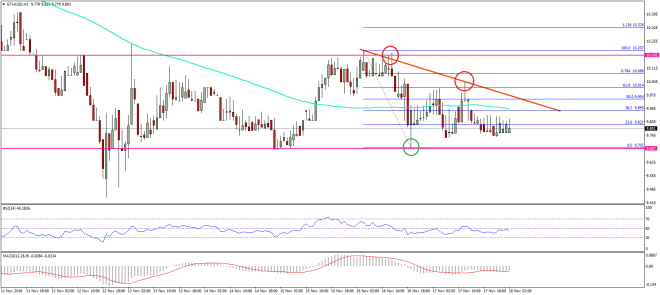

The 100 hourly simple moving average is also just below the trend line, which increases the value of the resistance. The last one is the range resistance at $10.20. As long as the price is in a range, it is wise not to trade ETH.
Hourly MACD – The MACD is currently in the bearish zone with stable momentum.
Hourly RSI – The RSI is struggling to break the 50 level, which is needed for buyers to take control.
Major Support Level – $9.70
Major Resistance Level – $10.20
Charts courtesy – SimpleFX