Key Highlights
- There was an extended decline in ETH price, as it broke the $92 support against the US Dollar.
- Yesterday’s highlighted major connecting bullish trend line with support at $91.50 on the hourly chart (ETH/USD, data feed via SimpleFX) was broken.
- The price may decline further towards $84 in the short term if sellers remain in action.
Ethereum price struggled to hold gains against the US Dollar and Bitcoin, and ETH/USD recently broke a major support for short-term downside move.
Ethereum Price Downside Move
Yesterday, we discussed that there can be a minor dip in ETH price towards $90 against the US Dollar. The price did move down after failing to break the 76.4% Fib retracement level of the last decline from the $100.62 high to $84.65 low. The price started moving down, and broke the $95 support. The worst thing was a break below the 100 hourly simple moving average at $94.20.
Later, the price extended its decline and broke the $92 support. Moreover, yesterday’s highlighted major connecting bullish trend line with support at $91.50 on the hourly chart of ETH/USD was cleared. These all were bearish signs ignited a downside move below $90. Later, the price moved below the 61.8% Fib retracement level of the last wave from the $84.60 low to $97.87 high.
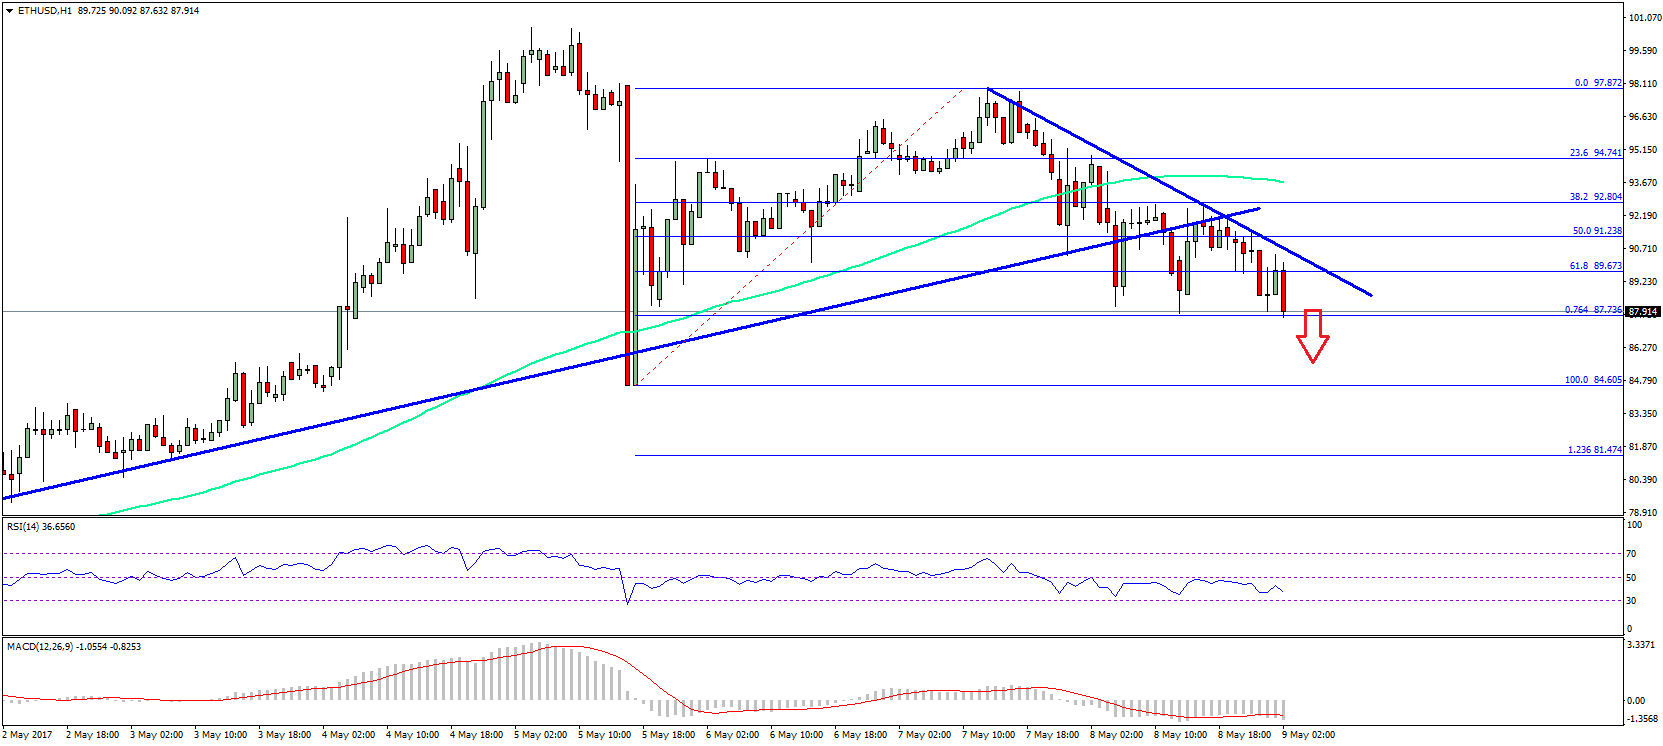
At the moment, the price is trading near the $88-87 swing low. It also coincides with the 76.4% Fib retracement level of the last wave from the $84.60 low to $97.87 high. So, there is a chance of a minor rise towards $89.50 where it may find resistance near a bearish trend line. Overall, it looks like the recent short-term break may ignite more losses towards $85-84.
Hourly MACD – The MACD is just moving nicely in the bearish zone.
Hourly RSI – The RSI is currently moving lower, and well below the 50 level.
Major Support Level – $84
Major Resistance Level – $90
Charts courtesy – SimpleFX