Key Highlights
- There was a sharp rise in ETH price, as it broke the $100 and $105 levels against the US Dollar.
- There was a break of a nice bullish pattern with resistance at $102 on the hourly chart (ETH/USD, data feed via SimpleFX).
- The price is currently trading with a lot of positive bias, and may soon break $110.
Ethereum price gained heavy bids during the past few hours against the US Dollar and Bitcoin, and ETH/USD broke an important level at $100.
Ethereum Price Upside Surge
Yesterday, we discussed that ETH price can dip towards $87-85 before it makes an upside move against the US Dollar. The price made a minor correction, and later gained pace for a move above $90. The price broke many important resistance levels on the way up like $90 and $95. The most significant move was above $100. It looks like buyers are loving the party and enjoying ride above $100.
There was even a break above a major extension level at $105. This has opened the doors for more gains in the near term. The next level could be $110. Before the upside, there was a break of a nice bullish pattern with resistance at $102 on the hourly chart of ETH/USD. Such patterns are clear signal, and the price did gain pace above $100.
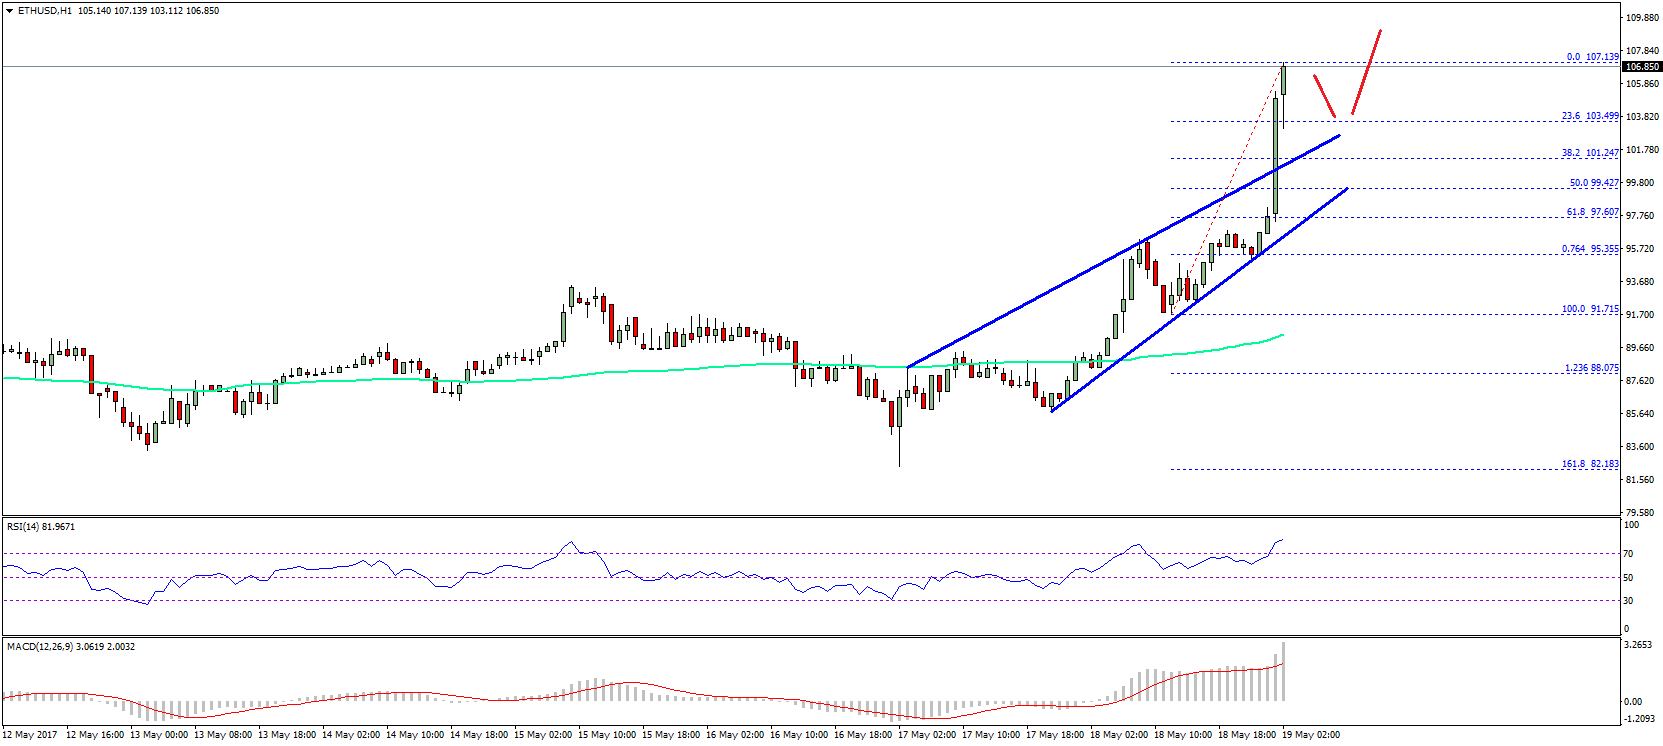
As of writing, the price traded as high as $107.13, and may correct a couple of points lower. On the downside, the pattern resistance at $102 may now act as a support. The 23.6% Fib retracement level of the last wave from the $91.71 low to $107.13 high is also around the same level. So, buying dips near $102-100 can be considered in the short term for $110.
Hourly MACD – The MACD is gaining pace in the bullish zone.
Hourly RSI – The RSI is now in the overbought levels.
Major Support Level – $102.00
Major Resistance Level – $110.00
Charts courtesy – SimpleFX