Key Highlights
- ETH price remained under a bearish pressure this past week against the US Dollar and traded below $10.00.
- There is a tiny connecting bullish trend line formed on the daily chart (data feed via SimpleFX) of ETH/USD, which is currently holding the downtrend.
- The price needs to close above the 100-day simple moving average in order to gain control.
Ethereum price mostly traded lower this past week against the US Dollar, but the ETH/USD pair may still gain pace for another upside move.
Ethereum Price Support
This past week, we saw how Ethereum price struggled to hold gains against the US Dollar, and also traded below the $10.00 support area. There was also a close below the 23.6% Fib retracement level of the last wave from the $5.69 low to $11.42 high. So, it ignited a bearish pressure on the price, taking it below the $10.00 support area. There was another important point to note. It’s the fact that the price continuously struggled to close above the 100-day simple moving average.
It also was a major factor of the price not able to gain pace above $10.00. At the moment, the price is trading near a major support zone. There is a tiny connecting bullish trend line formed on the daily chart (data feed via SimpleFX) of ETH/USD. It is acting as a support along with the 38.2% Fib retracement level of the last wave from the $5.69 low to $11.42 high. As long as the price is above it, there can be an attempt to trade higher once again.
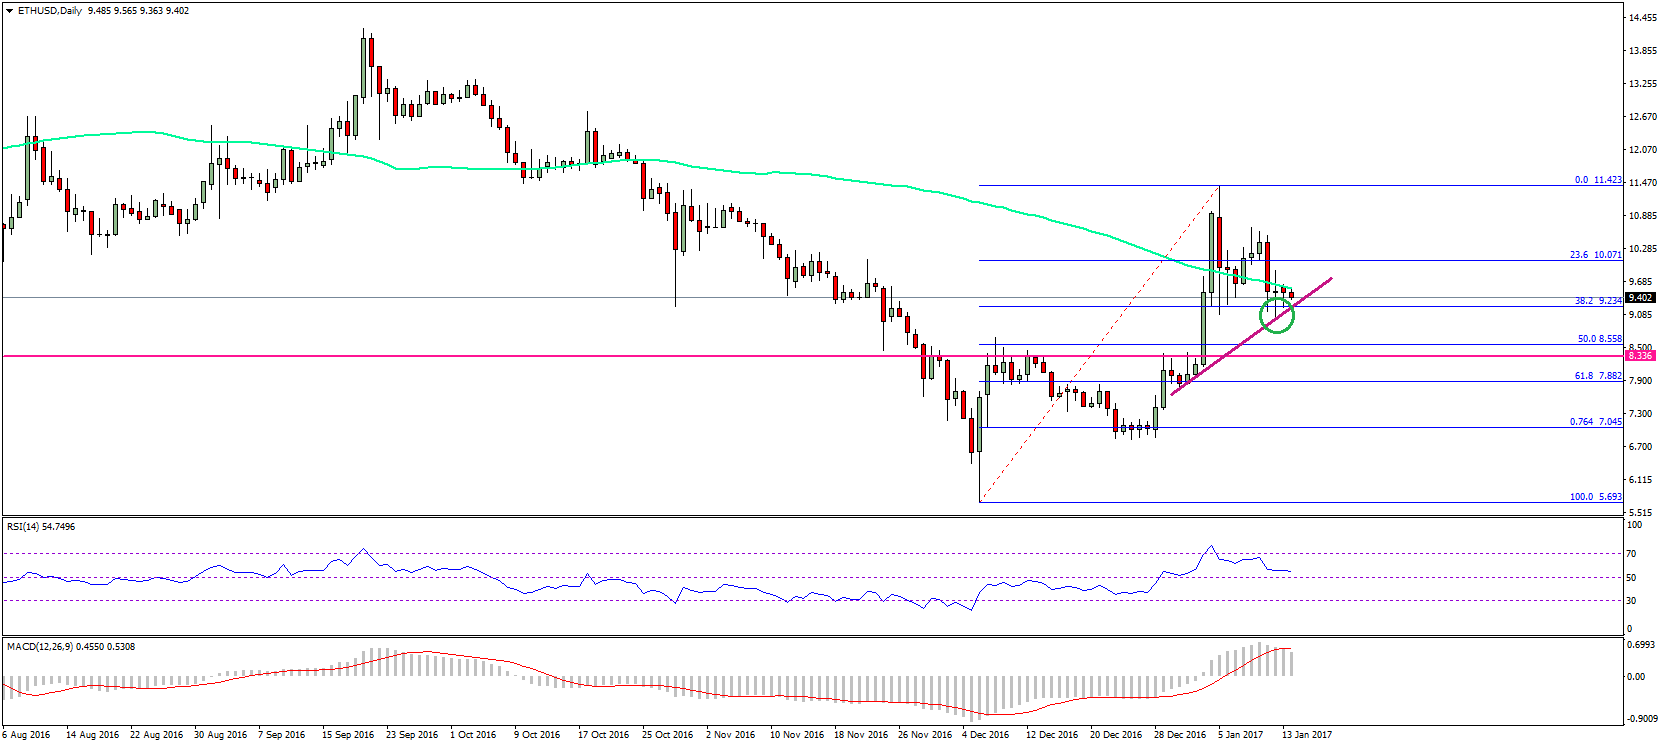
If there is a break below the trend line and the mentioned fib level support, there can be further declines towards $8.60 in the near term.
Daily MACD – The MACD is still in the bullish zone, which is a positive sign.
Daily RSI – The RSI is also above the 50 level, suggesting a bullish bias.
Major Support Level – $9.00
Major Resistance Level – $10.00
Charts courtesy – SimpleFX