Key Highlights
- ETH price managed to start a recovery against the US Dollar yesterday, and traded above the $9.60 resistance.
- There is likely a range pattern formed on the hourly chart (data feed via SimpleFX) of ETH/USD with resistance on the upside at $10.18.
- The price also remains supported on the downside at $9.60-70.
Ethereum price started a recovery yesterday against the USD, and it looks like the ETH/USD pair is currently trading with a positive bias.
Ethereum Price Support
Yesterday, we saw how ETH price climbed higher against the US Dollar and Bitcoin. There was a nice recovery pattern formed, as there was close above the $9.60-70 resistance area. The price traded higher and broke the 61.8% Fib retracement level of the decline from the $10.32 high to $9.44 low. However, the upside found resistance just below the $10.20 level, and started correcting lower.
The price started a correcting, and moved below the 38.2% Fib retracement level of the wave from the $9.44 low to $10.23 high. However, the downside found support near the last swing low of $9.65. The stated level is a major short-term support and is also the lower end of the range pattern. Moreover, it represents the 61.8% Fib retracement level of the wave from the $9.44 low to $10.23 high. So, it won’t be easy for the ETH sellers to break it.
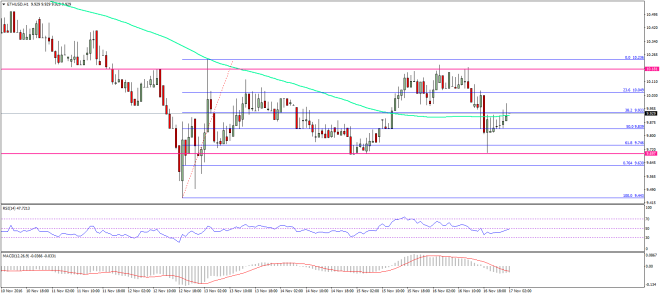

At the moment, the price is attempting to close back above the 100 hourly simple moving average. If they succeed, it may open the doors for a move towards the range resistance of $10.18. The ETH buyers need to break the range resistance area if they need to start a major recovery.
Hourly MACD – The MACD is currently in the bearish zone, but may change the slope.
Hourly RSI – The RSI is heading north, and attempting to break the 50 level.
Major Support Level – $9.65
Major Resistance Level – $10.18
Charts courtesy – SimpleFX