Key Highlights
- ETH price managed to gain momentum, and moved above the $41 resistance against the US Dollar.
- There is now a new bullish trend line with support at $39.50 formed on the hourly chart (ETH/USD, data feed via SimpleFX).
- The price is above the 100 hourly simple moving average, which might now provide support at $41.70.
Ethereum price popped a few points higher against the US Dollar, and now ETH/USD is well positioned above the $41.00 level for more gains.
Ethereum Price Support
There was a nice upside move in ETH price above $41 against the US Dollar. The price managed to break a couple of important resistances. The most important one was yesterday’s highlighted two bearish trend lines with resistance at $41.70 on the hourly chart (ETH/USD, data feed via SimpleFX). The price also attempted a break above the 61.8% Fib retracement level of the last decline from the $45.09 high to $38.15 low. However, it failed to climb above the $43.90 level.
At the moment, the price is correcting lower towards $41.70. It is currently testing the 23.6% Fib retracement level of the last wave from the $38.20 low to $43.90 high. However, there is a major support waiting on the downside near $41.70. It coincides with the 100 hourly simple moving average at $41.72. Moreover, the 38.2% Fib retracement level of the last wave from the $38.20 low to $43.90 high is also around the same support.
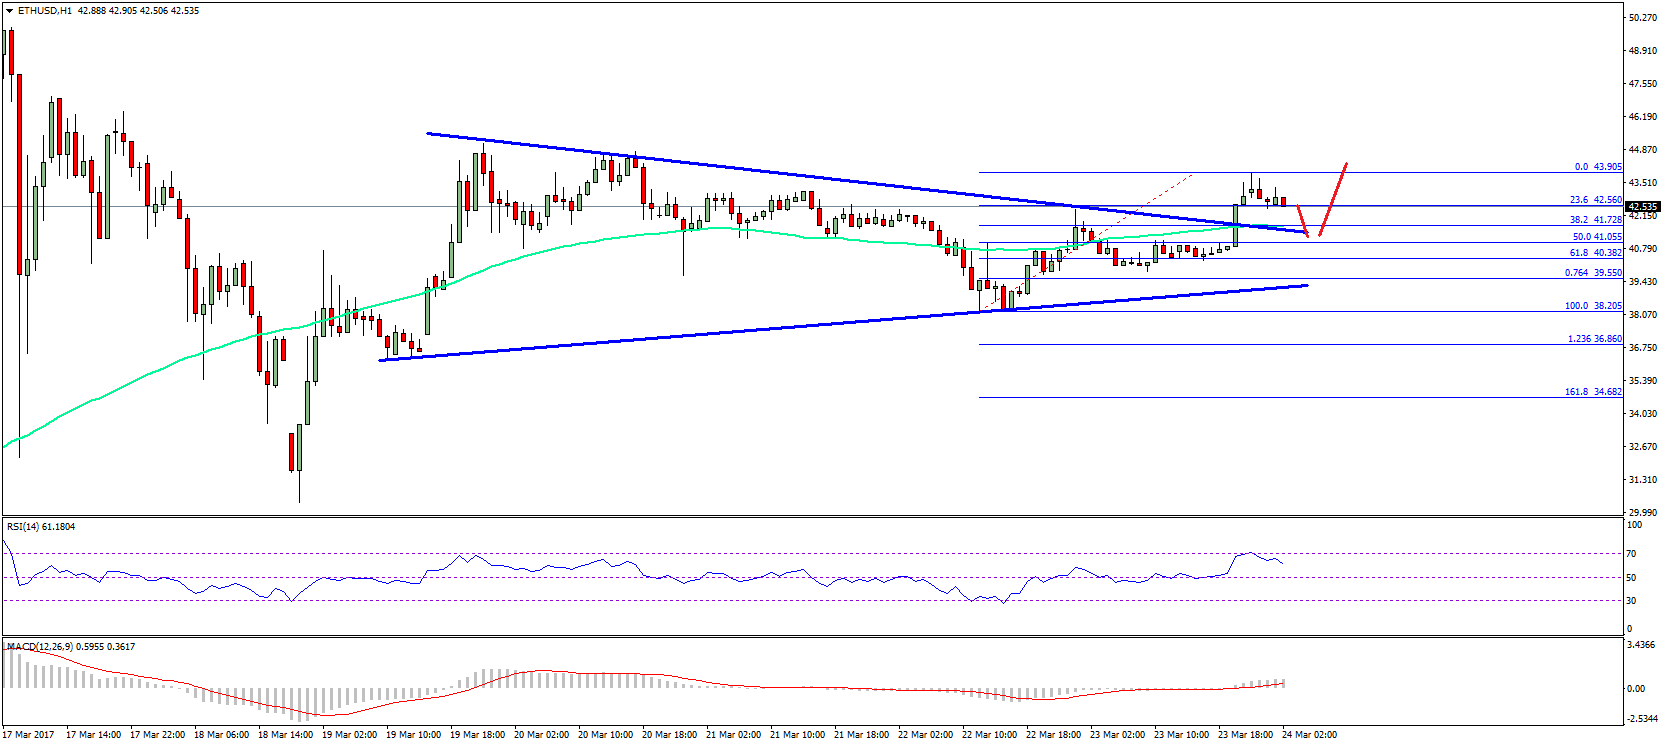
Last but not the least, the broken trend line is at $41.50. So, we can say there are many support levels on the downside. So, one may consider buying as long as the price is above a new bullish trend line with support at $39.50.
Hourly MACD – The MACD is slightly in the bullish zone, which is a positive sign.
Hourly RSI – The RSI is currently well above the 50 level.
Major Support Level – $41.00
Major Resistance Level – $43.90
Charts courtesy – SimpleFX