

Ethereum Price Key Highlights
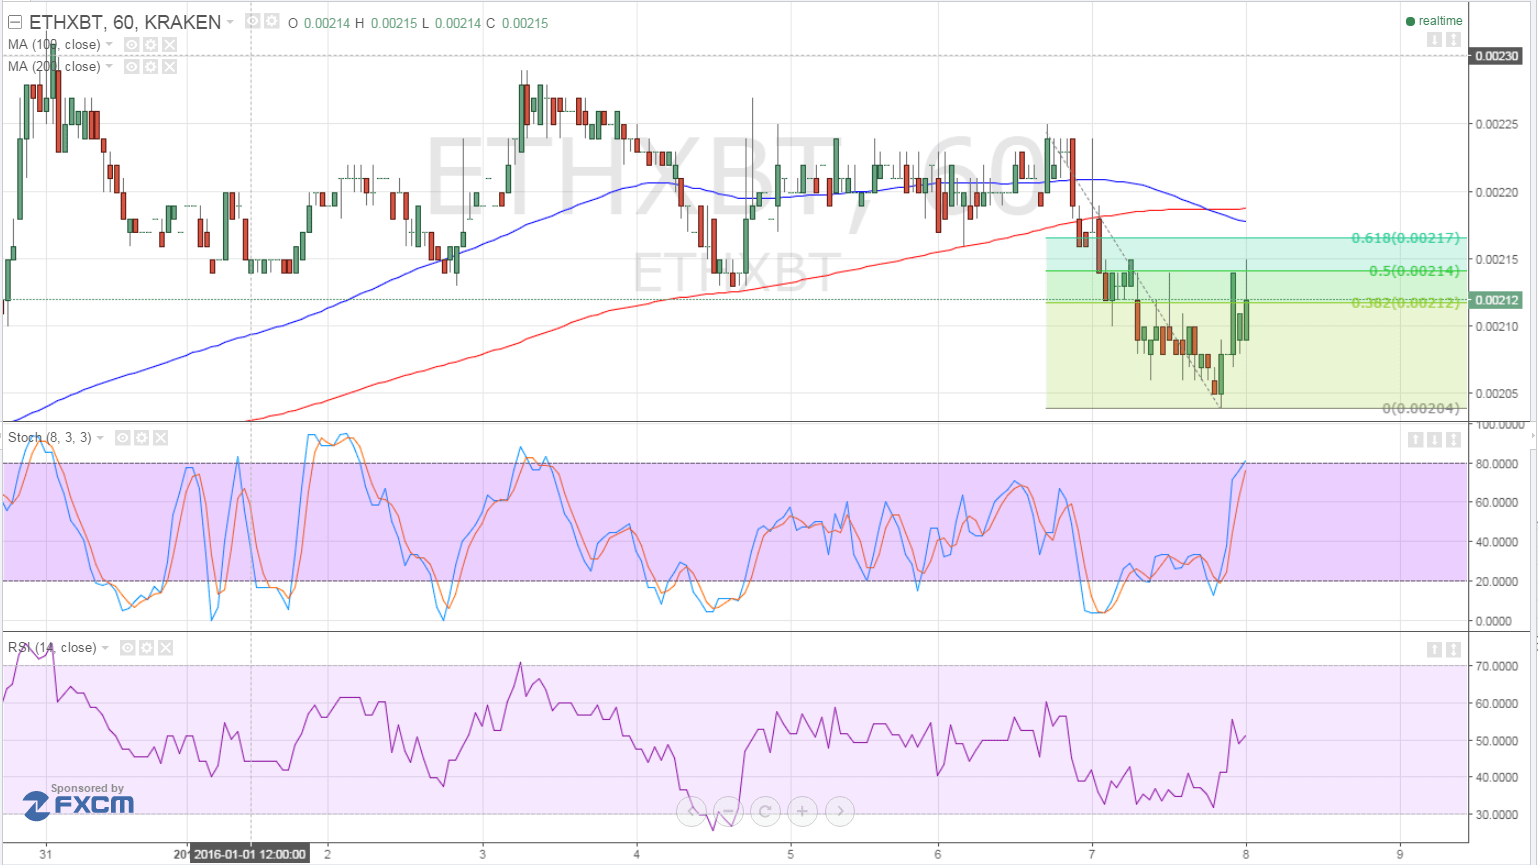
- Ethereum price had been moving inside a range between resistance near 0.00230 and support at 0.00215 before breaking to the downside.
- Price dipped to a low of 0.00205 before showing signs of a pullback.
- Using the Fibonacci retracement tool on the latest swing high and low shows that the 50% level lines up with the broken support, which might now hold as resistance.
Ethereum price might be ready to resume its drop to its previous lows or much lower after correcting to an area of interest.
Technical Indicators Signals
The 100 SMA is making a downward crossover from the longer-term 200 SMA, signaling that the path of least resistance is to the downside. These moving averages are near the 61.8% Fibonacci retracement level, which might act as the line in the sand for any pullback setups.
A break above the 61.8% Fib or the 0.00217 area might be enough to show that an uptrend is in order, potentially taking ethereum price back up to the range resistance at 0.00230 or higher.
Stochastic is moving up, which means that buyers are still in control of ethereum price action for the time being, but is nearing the overbought area. Once the oscillator reaches 80.0 and turns lower, selling pressure could resume.
Meanwhile, RSI is on middle ground and on the move up, hinting that buyers aren’t ready to give up just yet. In that case, a larger correction to the 61.8% Fib or the moving averages around 0.00220 might be possible.

Upside Bitcoin Pressure
Bitcoin price has been on a tear lately, breaking above a previous triangle consolidation pattern and putting downside pressure on ethereum price. Other digital currencies are also reeling from the risk-off market environment these days, as the stock market slump has discouraged investors from loading up on higher-yielding assets.
In turn, traders have been pursuing more stable holdings such as the U.S. dollar and Japanese yen. In the cryptocurrencies arena, bitcoin has been the most preferred one among the bunch, which suggests that further declines might be seen in ethereum price if the current market sentiment persists.
With that, ethereum price might even break below the previous lows of 0.00205 and go on to test the major psychological support at 0.00200. Stronger bearish momentum could take it down to the next area of interest at 0.00190 then to 0.00180.
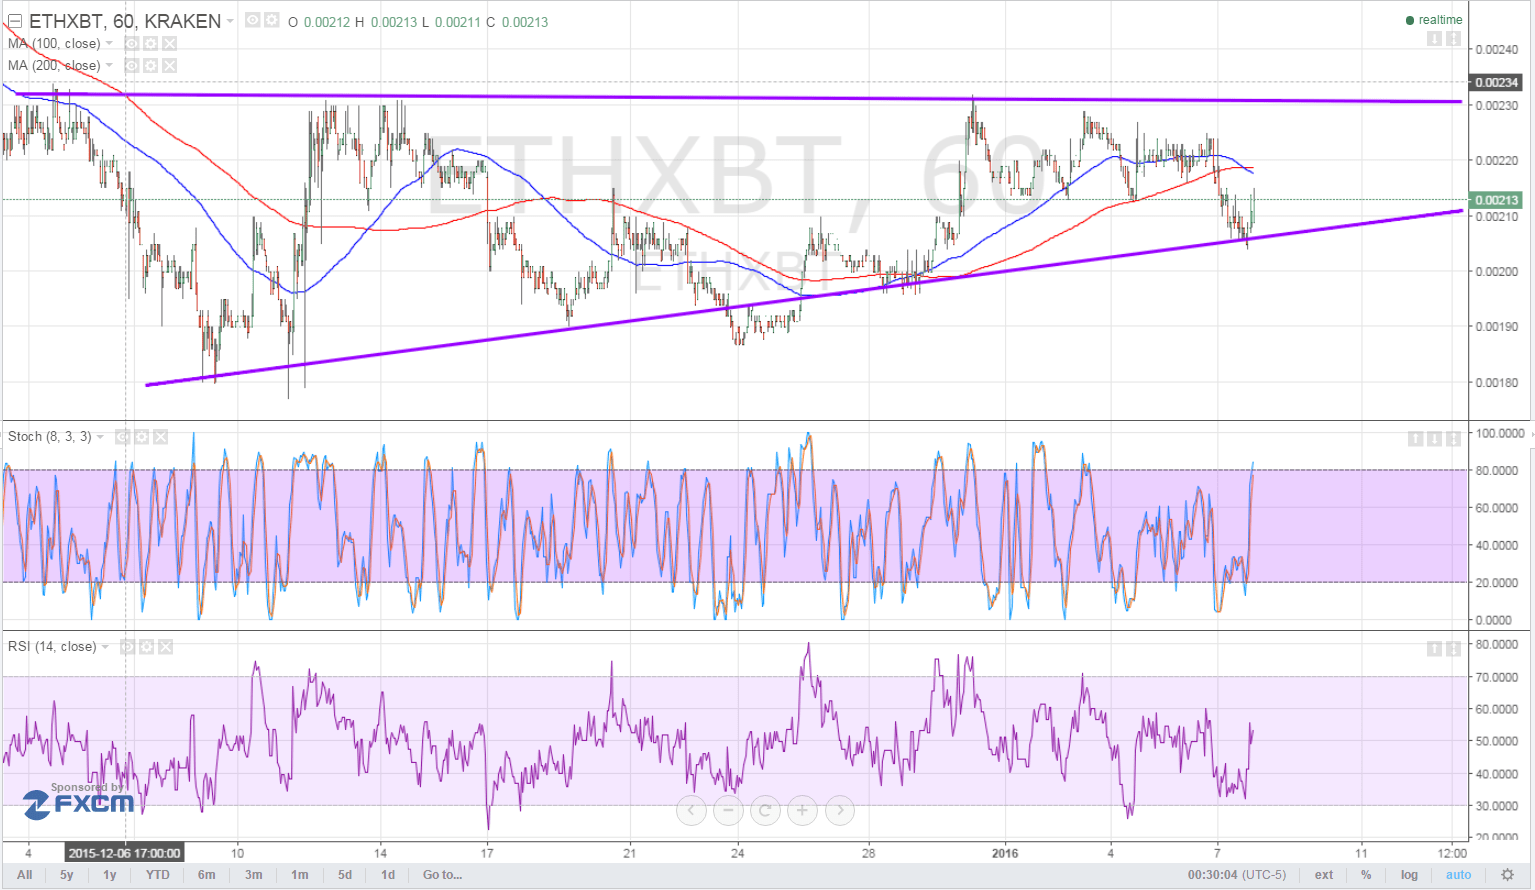

Zooming back much further shows that ethereum price is actually testing an ascending triangle support and might be due for a bounce to the resistance. Depending on how financial market events for the next few days plays out, a rally back to the top or a break below the rising trend line support could be seen.
Intraday support level – 0.00205
Intraday resistance level – 0.00215
Technical Indicators Settings:
- 100 SMA and 200 SMA
- Stochastic (8, 3, 3)
- RSI (14)
Charts from Kraken, courtesy of TradingView