

Ethereum Price Key Highlights
- Ethereum price had previously consolidated inside a descending triangle pattern, forming lower highs and finding support at 0.00250.
- Price made an upside breakout, signaling that further gains are likely.
- Before the climb gains traction, ethereum price could still pull back to the broken triangle resistance at 0.00260.
Ethereum price seems to have its sights set higher after breaking out of a descending triangle on its 1-hour chart.
Next Resistance Levels
At the moment, ethereum price is testing the near-term resistance at the 0.00300 level, waiting for more bulls for another leg higher. An upside break past this level could take it up to the next area of interest at 0.00330-0.00350 then onwards to the larger triangle highs at 0.00400.
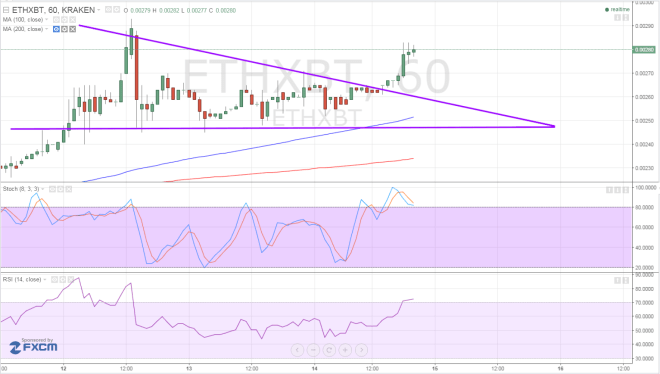

The 100 SMA is above the 200 SMA, indicating that the path of least resistance is to the upside and that further gains are in the cards. In addition, the short-term SMA is moving farther away from the longer-term SMA, which means that bullish momentum is building up.
RSI is heading north, also confirming that buying pressure is present. The oscillator is already near the overbought area, however, so a return in selling pressure could happen soon.
Stochastic is already indicating overbought conditions and is turning lower, suggesting that sellers could take control of price action. In that case, ethereum price could retreat to the triangle resistance or even back towards support.
Long-term Breakout
Zooming out to the 4-hour time frame shows that ethereum price also recently broke above a large triangle pattern, adding confirmation that an uptrend is underway. Meanwhile, bitcoin has been weakening against the US dollar recently, breaking below its own consolidation pattern.
The US dollar has drawn support from the risk-off market environment since the start of the year and also upbeat fundamentals. Data lined up today includes the December retail sales and PPI readings, with strong results likely to spur more demand for the dollar against cryptocurrencies.
For now, ethereum price is able to benefit from the selloff in bitcoin, which is deemed as a riskier holding in times of risk aversion. If you’re bullish on this one, wait for an upside breakout past the recent candle highs or wait for a potential limit entry on a pullback to the triangle resistance.
If you’re bearish, you could short at the triangle highs around 0.00300 onto the broken resistance at 0.00260 or even until the triangle support at 0.00250.
Intraday support level – 0.00250
Intraday resistance level – 0.00300
Technical Indicators Settings:
- 100 SMA and 200 SMA
- RSI (14)
- Stochastic (8, 3, 3)
Charts from Kraken, courtesy of TradingView