Key Highlights
- Ethereum price after posting a new weekly high of $14.68 against the US Dollar found sellers and moved down.
- There was a breakout pattern cleared on the hourly chart (data feed via Kraken) of ETH/USD before the downside move started.
- The pair found support near the 200 hourly simple moving average, but closed below the 100 hourly SMA.
Ethereum price is currently struggling to hold the recent bullish bias, and it looks like there is a chance of another dip after a minor move higher.
Ethereum Price Recovery
Ethereum price ETH jumped higher this past week and broke a couple of important resistance levels against the US Dollar to challenge the $15.00 handle. The ETH/USD pair failed to sustain the bullish bias, and started correcting lower. The mentioned correction phase started with a break of a contracting triangle pattern formed on the hourly chart (data feed via Kraken) of ETH/USD.
The downside drift was sharp, as the pair also settled below the hourly simple moving average, which is not a good sign for the people looking to enter a buy trade in the short term. However, the pair finally found support near the 200 hourly SMA, and a bullish trend line formed on the same chart.
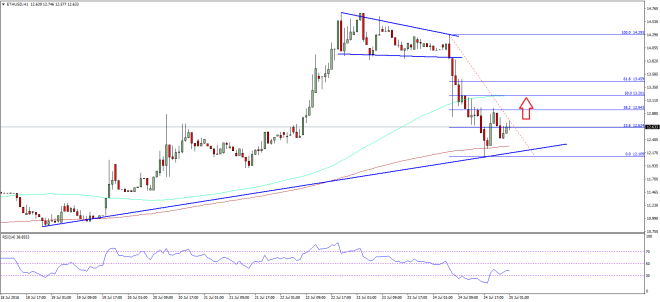

The pair already started a recovery, which can take it towards the 50% Fib retracement level of the last drop from the $14.29 high to $12.10 low. However, I think the price may find sellers around the 100 hourly SMA and may dip once again to complete a 3-wave correction pattern. So, one may plan and trade accordingly, as there can be a few swing moves in the ETH/USD pair in the short term.
Hourly MACD – The MACD is currently stable and moving away from the bearish slope.
Hourly RSI – The RSI is well below the 50 level, which is a bearish sign.
Major Support Level – $12.20
Major Resistance Level – $13.20
Charts courtesy – SimpleFX