Key Highlights
- Ethereum price is trading near a crucial area, and both buyers and sellers must be very careful moving ahead.
- There is a contracting triangle pattern forming on the 4-hours chart (data feed via Kraken), which may ignite a lot of moves in the near term.
- A break below the triangle support area may call for a change in the trend for Ethereum price.
Ethereum price traded higher during the past couple of days. However, it is now trading near a major breakout zone at $6.60-65.
Ethereum Price – Watch Out For a Break
Ethereum price after correcting lower traded back higher this past week, and currently trading near the last swing high of $6.60-65. It represents a major resistance area, and acted as a barrier for buyers on many times. A contracting triangle pattern is forming on the 4-hours chart (data feed via Kraken), which can be seen as a formation for the next move.
A break above the $6.65 level may call for more gains in the near term. The price could even head towards $7.0 in that situation. On the downside, a break below the triangle support trend line may take the price towards the 100 simple moving average (4-hours, data feed via Kraken). An initial support a bullish trend line formed via connecting swing lows. A break below it might call for a test of the 23.6% Fib retracement level of the last wave from the $3.30 low to $6.62 high.
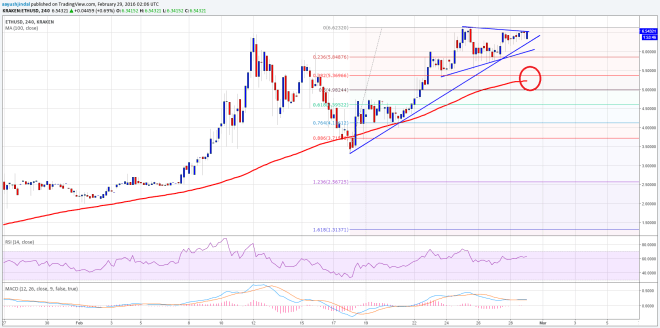

However, the most important support is around the 100 MA, which is just below the 38.2% Fib retracement level of the last wave from the $3.30 low to $6.62 high.
4-hours MACD – The MACD may change the slope to the bullish zone, which is a warning to sellers.
4-hours RSI – The RSI is above the 50 level, calling for a bullish break in the short term.
Intraday Support Level – $5.80
Intraday Resistance Level – $6.65
Charts courtesy of Kraken via Trading View