Key Highlights
- Ethereum price remained under a bearish pressure against the US dollar, and may face sellers in the short term.
- Yesterday’s highlighted bearish trend line on the hourly chart (data feed via Kraken) of ETH/USD acted as a perfect barrier for the pair and pushed it down.
- The price is currently above the $10.20 support area, but a break below could ignite more downsides.
Ethereum price continued to remain under a bearish pressure, and if it increases, ETH could weaken further in the near term.
Ethereum Price Barrier
Ethereum price ETH struggle continues against the US Dollar, and every time the buyers attempt to take the price higher sellers appear and defend the upside move. Yesterday, I highlighted a bearish trend line on the hourly chart (data feed via Kraken) of ETH/USD, and was expecting it to act as a resistance.
It did act as a barrier for the upside move, and prevented a break in ETH/USD. I still think as long as the price is below the highlighted trend line resistance, it may continue to struggle. It has also moved below the 100 hourly simple moving average, which is bearish sign and can be seen as a resistance zone. Moreover, there are no positive signs emerging on the hourly chart, suggesting a possible recovery in the short term.
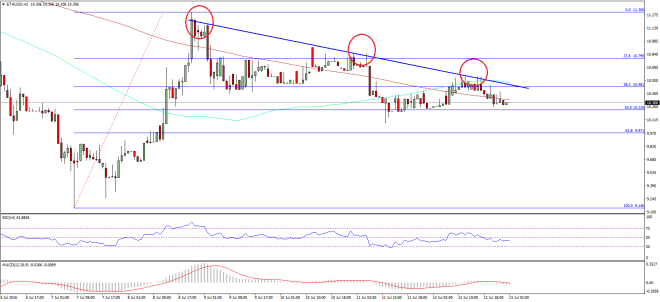

Yesterday’s highlighted support area of the 50% Fib retracement level of the last leg from the $9.14 low to $11.30 high is still in place and acting as a bid zone. A break below the stated fib level could ignite further losses in the ETH/USD pair moving ahead.
Hourly MACD – The MACD is still positioned in the bearish zone, which is a bearish sign.
Hourly RSI – The RSI is also below the 50 level, signaling that the sellers are in action as this moment.
Major Support Level – $10.20
Major Resistance Level – $10.48
Charts courtesy – SimpleFX