Reason to trust
How Our News is Made
Strict editorial policy that focuses on accuracy, relevance, and impartiality
Ad discliamer
Morbi pretium leo et nisl aliquam mollis. Quisque arcu lorem, ultricies quis pellentesque nec, ullamcorper eu odio.
Key Highlights
- Ethereum price after the recent assault against the US Dollar started to catch bids near $10.20 against the US Dollar.
- There is a contracting triangle pattern formed on the hourly chart (data feed via Kraken) of ETH/USD, which may provide us the next break.
- A break above it might take the price higher, and could ignite a larger recovery.
Ethereum price remained under a lot of pressure, but if the sentiment remains stable, there is a chance of a minor correction in the near term.
Ethereum Price Break
Ethereum price ETH looks like stable now against the US Dollar after a sharp decline due to the DAO attack recently. The price traded below the $11.00 support area and almost tested the $10.0 handle. The price already started a correction, and traded as high as $13.78 where it found sellers again.
It would be interesting to see how the price trades in the near term, as there is a contracting triangle pattern formed on the hourly chart (data feed via Kraken) of ETH/USD. The highlighted pattern may play a major role in the near term. A break above the triangle might call for a larger recovery in ETH/USD, and on the other hand, if the price breaks down, then there is a chance of a test of $10.00.
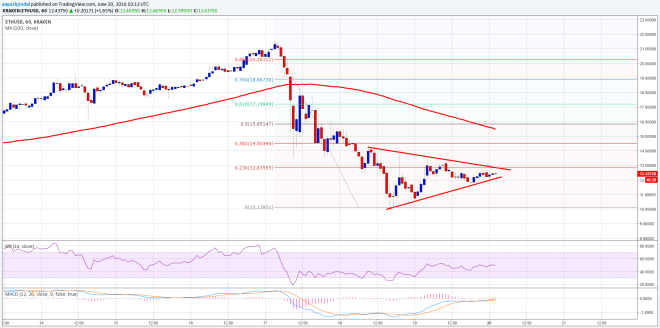
The price is also below the 23.6% Fib retracement level of the last drop from the $21.10 high to $10.13 low. Only a break above the stated fib level could push the price back higher and towards the 50% Fib retracement level of the same wave.
Hourly MACD – The MACD is slowly moving into the bullish zone, which is a positive sign for the bulls.
Hourly RSI – The RSI is just above the 50 level, suggesting that the price may attempt to move higher.
Major Support Level – $12.00
Major Resistance Level – $12.80
Charts courtesy of Kraken via Trading View