

Key Highlights
- Ethereum price moved higher recently against the US Dollar and traded above the $12.00 resistance area
- If we look at the daily chart of the ETH/USD, then there was a break above a bearish trend line (data feed via Kraken) of ETH/USD.
- The best part is the fact that the price is above the 100-day simple moving average, which is a positive sign for the long term traders.
Ethereum price is showing a lot of bullish signs versus the US dollar on the daily chart, but there is a warning as well. Read in detail to know more.
Ethereum Price – Double Top or Upside Move?
Ethereum price ETH after trading as low as $7.00 on the daily chart started to move higher vs the US dollar. There was a move above a bearish trend line formed on the daily chart (data feed via Kraken) of ETH/USD, which encouraged the bulls to take the price higher. However, the price traded as high as $14.75 where it found sellers and currently moving down.
Now, here is a concern for the BTC bulls. The recent failure around the $14.75 level is just around the last swing high of $15.00. So, there is a chance of the price creating a double top pattern. If the highlighted pattern if true, then there may be a sharp downside move in ETH. Now, if we look at the positive signs, then the daily RSI is positioned well above the 50 level, and the price is also above the 100-day simple moving average.
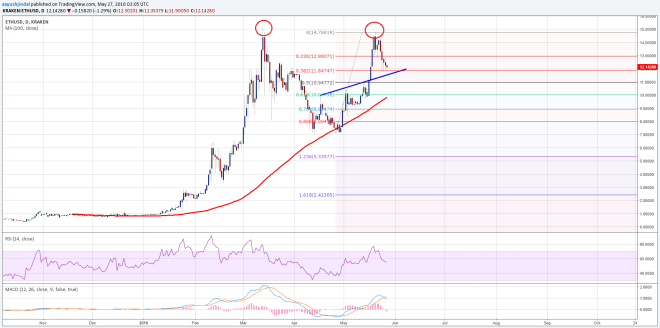

Moreover, the broken trend line may also act as a support area in the short term. So, we can keep a close eye on it in the medium term.
Daily MACD – The daily MACD is in the bearish slope, suggesting more losses.
Daily RSI – The RSI is above the 50 level, which can encourage the ETH bulls moving ahead.
Weekly Support Level – $10.00
Weekly Resistance Level – $13.00
Charts courtesy of Kraken via Trading View
Header Image: NewsBTC