
Reason to trust
How Our News is Made
Strict editorial policy that focuses on accuracy, relevance, and impartiality
Ad discliamer
Morbi pretium leo et nisl aliquam mollis. Quisque arcu lorem, ultricies quis pellentesque nec, ullamcorper eu odio.
- ETH price broke a major resistance area near $133-134 to climb higher against the US Dollar.
- The price settled above the key $134 resistance to move into a positive zone.
- There was a break above a major contracting triangle with resistance at $133 on the 4-hours chart of ETH/USD (data feed via Kraken).
- The pair is currently correcting lower, but it is likely to find a strong buying interest near $134.
Ethereum price is trading with a bullish bias versus the US Dollar and Bitcoin. ETH/USD climbed towards $144 and it is currently correcting lower towards key supports near $134.
Ethereum Price Analysis
This past week, there was a couple of swing moves towards the $128 level in ETH price against the US Dollar. Later, the ETH/USD pair formed a solid support near the $129 and $130 levels. Finally, buyers gained traction and broke the $132 resistance area to move into a positive zone. The upside move was strong as the price even broke the $134 level and the 100 simple moving average (4-hours). The price action was constructive, opening the doors for more upsides above the $134 level.
Moreover, there was a break above a major contracting triangle with resistance at $133 on the 4-hours chart of ETH/USD. The pair rallied above the $140 resistance level. It traded close to the $144 resistance zone. A high was formed just below $144 and later the price started a downside correction. It broke the 23.6% Fib retracement level of the last wave from the $128 low to $144 high. On the downside, there are many supports near the $135 level and the 100 simple moving average (4-hours).
Besides, the 50% Fib retracement level of the last wave from the $128 low to $144 high is also near the $135 level to act as a support. Therefore, if the price continues to move down, it could find a strong support near the $134 or $135 level. If there is a downside break below $134, the price may move back in a bearish zone.
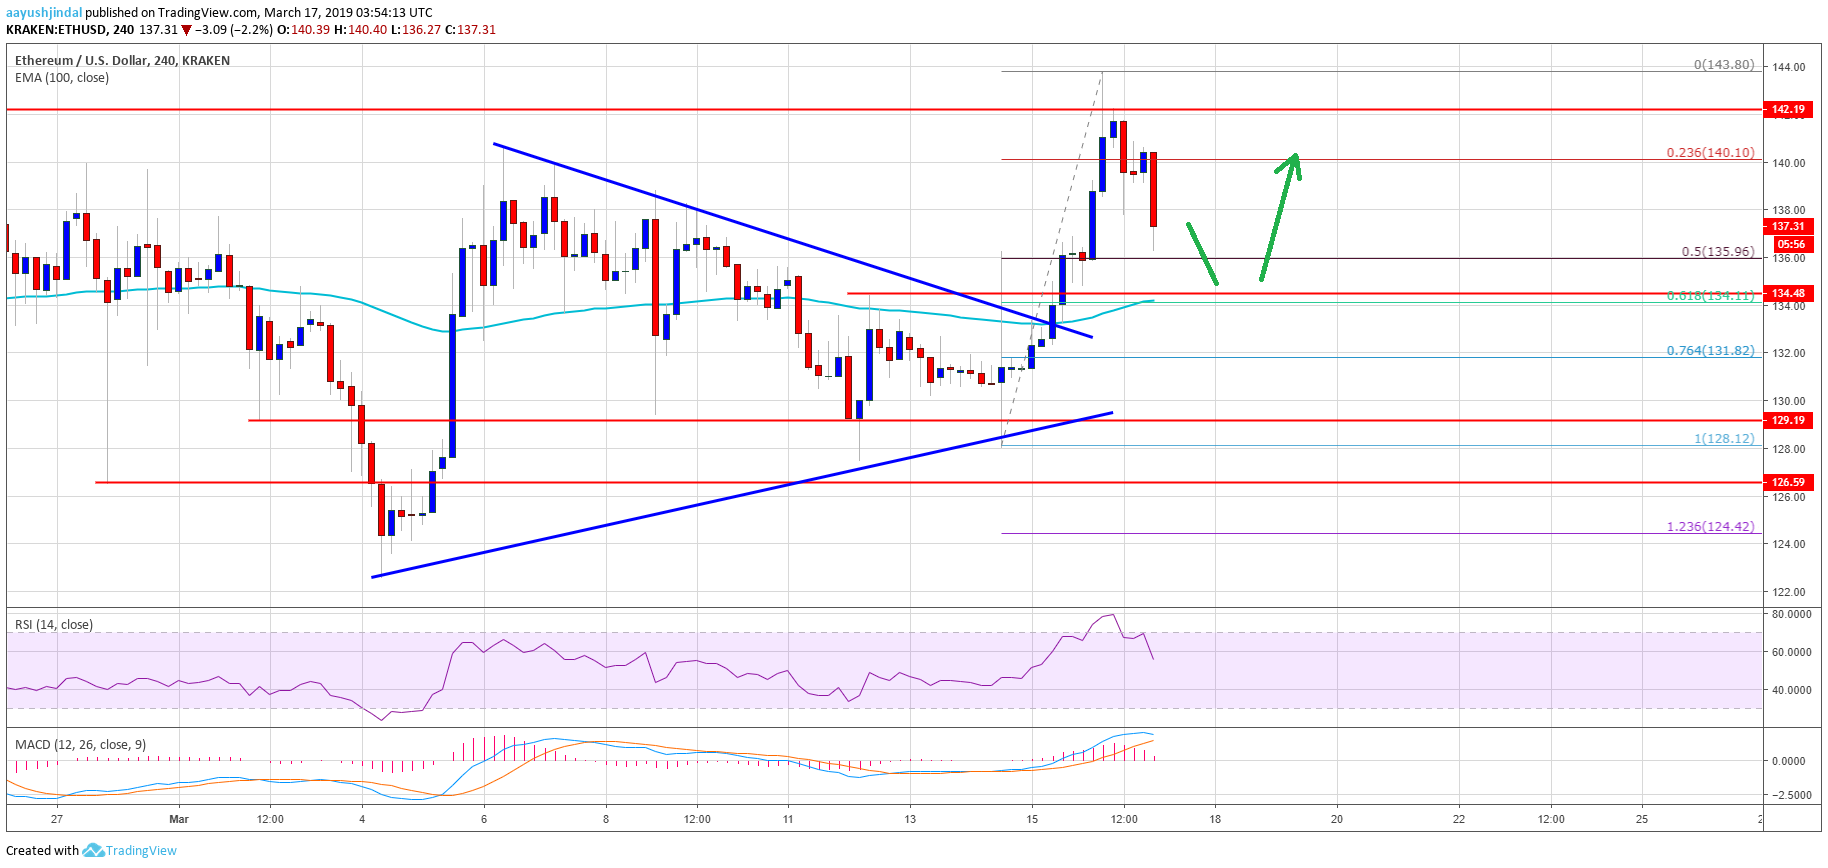
The above chart indicates that ETH price made a nice upside move above the $134 and $140 barriers. There are many bullish signs above the $135 level and the 100 SMA. In the short term, there could be a consolidation phase above $135 before the price makes the next move. On the upside, the main hurdles near the $142, $144 and $145 levels.
Technical Indicators
4 hours MACD – The MACD for ETH/USD is about to move back in the bearish zone.
4 hours RSI – The RSI for ETH/USD is moving lower from the 80 level and it could move towards the 50 level.
Major Support Level – $134
Major Resistance Level – $142