Key Highlights
- Ethereum price after a minor downside move this past week against the US Dollar recovered.
- There is a monster contracting triangle formed on the daily chart of the ETH/USD pair (data feed via SimpleFX), which is providing support.
- The price may move higher in the coming days and test the upper triangle resistance.
Ethereum price may continue to find bids on the downside versus the US Dollar, as long as it is above the $10.80 support area.
Ethereum Price Range
Ethereum price ETH was seen trading lower this past week against the US Dollar, as ETH/USD remained under a bearish pressure. The price dipped and tested the 200-day simple moving average. However, the Ether bulls managed to defend the downside move and pushed the price back higher. As mentioned, there is a monster contracting triangle formed on the daily chart of the ETH/USD pair (data feed via SimpleFX).
It was also one of the main reasons why the ETH/USD pair found support on the downside. Another key point was that the price also failed to close below the 23.6% Fib retracement level of the last wave from the $7.09 low to $12.64 high. So, there is a chance that the price may head higher in the near term. However, on the upside there are many hurdles for the ETH buyers.
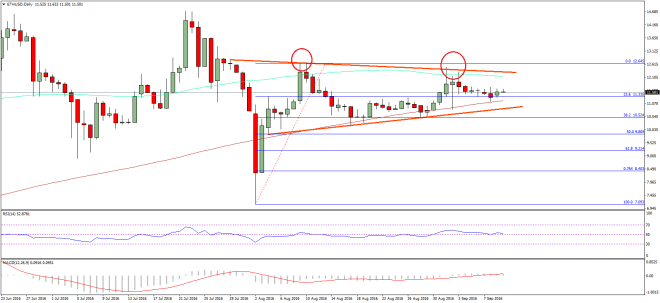

First, the 100-day simple moving average is waiting to act as a barrier. The second and the most important resistance is near the triangle upper trend line highlighted on the daily chart. So, the price may bounce in the short term, but any major gains might only happen upon a break of the triangle.
Daily MACD – The MACD is almost flat, and suggesting a range pattern in ETH.
Daily RSI – The RSI has moved above the 50 level, which is a positive sign for the ETH bulls.
Major Support Level – $11.00
Major Resistance Level – $12.00
Charts courtesy – SimpleFX