Key Highlights
- Ethereum price made many attempts recently to trade higher, but failed to sustain gains against the US Dollar.
- Actually, there is a major bearish trend line formed on the daily chart of the ETH/USD pair (data feed via SimpleFX), which is stopping gains.
- As long as the price is below it, the ETH bulls may find it very tough to push the price higher.
Ethereum price is struggling to break higher versus the US Dollar. The main reason for the recent failures are explained below.
Ethereum Price Resistance
Ethereum price ETH made another attempt to trade higher recently against the US Dollar, but it failed miserably. The main reason for a failure is a major bearish trend line formed on the daily chart of the ETH/USD pair (data feed via SimpleFX). It acted as a resistance on many occasions and stopped the upside move. I believe as long as the price is below the highlighted trend line, the life of bulls may not be easy.
The Ether bulls may continue to struggle. On the flip side, there are a few positives as well. The price is above the 50% Fib retracement level of the last drop from the $14.69 high to $8.32 low. So, it means the price is in the bullish zone. It’s just that the buyers are not able to break the 61.8% Fib retracement level of the last drop from the $14.69 high to $8.32 low.
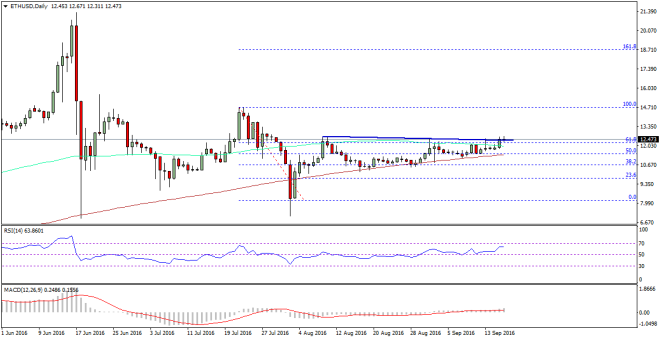

Moreover, on the upside, the 100-day simple moving average is also acting as a hurdle. I believe, we may continue to see ranging moves before there is a rise in Ether price moving ahead.
Daily MACD – The MACD is slightly in the bullish zone, which is a positive sign.
Daily RSI – The RSI is currently above the 50 level, which is encouraging for the ETH bulls.
Major Support Level – $11.50
Major Resistance Level – $12.60
Charts courtesy – SimpleFX