Key Highlights
- ETH price after trading above the $325 level against the US Dollar found sellers and moved down.
- There is an expanding triangle forming with support at $291 on the 4-hours chart of ETH/USD (data feed via SimpleFX).
- The pair might continue to trade in an expanding range with current resistance above $327.
Ethereum price is trading in a range against the US Dollar, but moved higher versus Bitcoin. ETH/USD remains supported on the downside near $291.
Ethereum Price Support
This past week, there was a decent upside move in ETH price above the $325 level against the US Dollar. The price traded to a new monthly high of $327.28 before it faced a lol of sellers and started a downside move. There was a sharp downside move and the price traded below the $296 support area. A low was formed recently at $287.41 from where the price started a new upside move.
It traded above the 100 simple moving average (H4) and the 50% Fib retracement level of the last decline from the $327.28 high to $287.41 low. However, the upside move was capped by the $312 level. The 76.4% Fib retracement level of the last decline from the $327.28 high to $287.41 low also acted as a resistance. ETH is currently correcting lower and it seems like there is an expanding triangle forming with support at $291 on the 4-hours chart of ETH/USD.
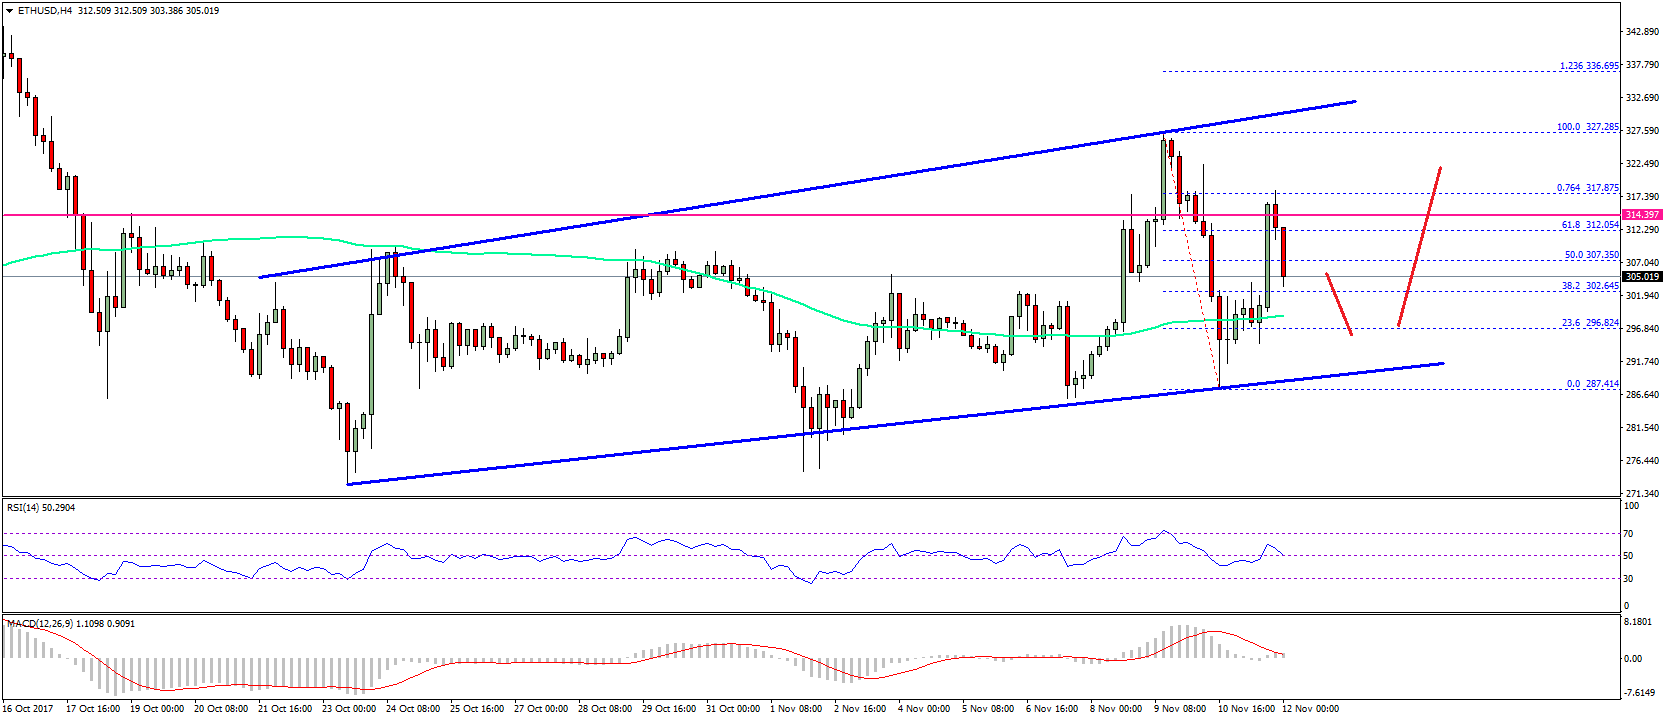
On the downside, there is a decent support forming near $291 and the 100 simple moving average (H4). As long as the pair is above the 100 SMA and the $291-290 area, it can initiate a new short-term bullish wave. Overall, there is an expanding range forming with support at $291 and resistance above $327.
4-hours MACD – The MACD is slightly in the bullish zone.
4-hours RSI – The RSI is currently just above the 50 level.
Major Support Level – $291
Major Resistance Level – $330
Charts courtesy – SimpleFX