Key Highlights
- ETH price surged higher during the past few days and moved above $120 against the US Dollar.
- There are two bullish trend lines formed with support at $99 and $65 on the daily chart of ETH/USD (data feed via SimpleFX).
- The pair may soon break the recent high of $127.95 and trade above $130.
Ethereum price gained heavily against the US Dollar and Bitcoin, and now ETH/USD may soon break $130 for further gains in the near term.
Ethereum Price Buy Dips
In the last weekly analysis, we analyzed a crucial bearish trend line with resistance near $88 on the 4-hours chart of ETH/USD. We were waiting for a break above $90 in ETH price against the US Dollar for further gains. The price did break the 61.8% Fibonacci retracement level of the last decline from the $100.80 high to $70.00 low to ignite an upside move. There were sharp gains, as the price climbed above the $100, $110 and $120 levels.
A new all-time high was formed near $127.95 (data feed via SimpleFX). The price is currently trading near $124 and consolidating. An initial support on the downside is around $117. It also coincides with the 23.6% Fib retracement level of the last wave from the $82.35 low to $127.95 high. If the pair dips from the current levels, it may find support near $120 or $117.
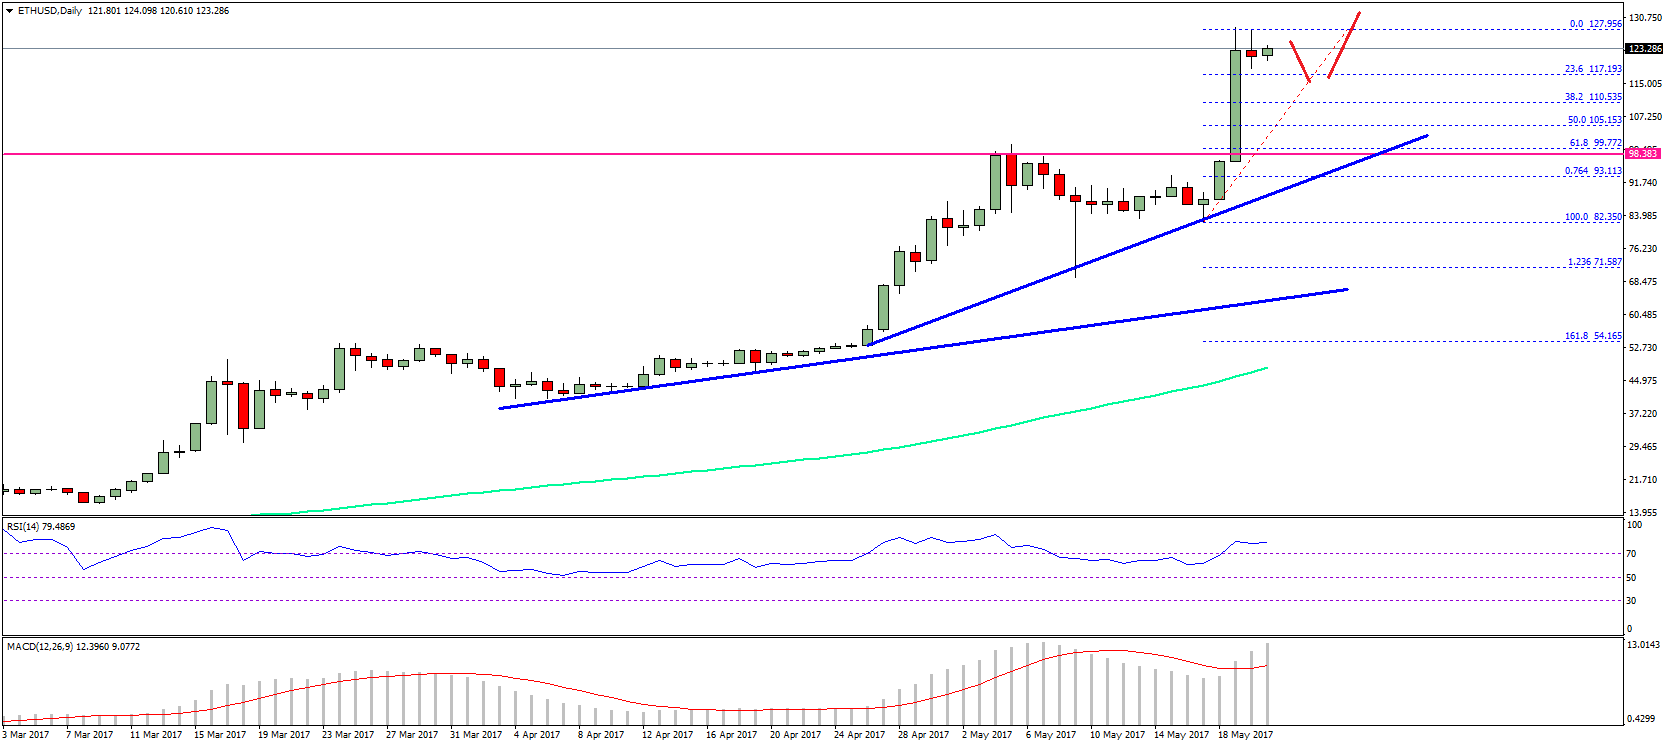
One may consider buying dips near $120 in the near term. The overall trend is bullish, as there are two bullish trend lines formed with support at $99 and $65 on the daily chart of ETH/USD. The pair may soon break higher and climb above $128. If buyers remain in action, there can be a break above $130 for a move towards $135-138 soon.
Daily MACD – The MACD is placed strongly in the bullish zone.
Daily RSI – The RSI is in the overbought levels.
Major Support Level – $117.00
Major Resistance Level – $130.00
Charts courtesy – SimpleFX