

- ETH liquidation at $300
- Ahead of Serenity, developers prefer Ethereum over competing platforms.
A raft of supportive fundamentals, on-chain development, and optimism amongst investors is behind Ethereum’s (ETH) resilience. Although under pressure, the uptrend is solid. Even so, for buyers’ confirmation, bulls must clear $300.
Ethereum Price Analysis
Fundamentals
Year-to-date, Ethereum (ETH) is lagging the world’s most valuable digital asset, Bitcoin (BTC). That is despite the positive correlation they share. However, it wasn’t until May that prices began flashing, printing green and edging higher, breaking above the $200 and later $250 level.
Currently, positive fundamentals will likely propel prices above the $300-mark building a foundation for $400 by Q2 2019. At the fore is the expected winter because of the implementation of EIP 1234. Through this, miner rewards will be slashed by a third. It is this “Thirding” that the amount of ETH in circulation will drop, allowing supply-demand dynamics to price ETH fairly.
With EIP-1234 in place, here are updated Ethereum issuance numbers in 2019.
In summary, a lot of unnecessary selling pressure is now out of the market and inflation is around 4.7%. pic.twitter.com/DbHFUWZhza
— eric.eth (@econoar) August 31, 2018
Most likely, prices will be rounded higher at the reprieve of holders who had to contend with last year’s steep price falls. But it’s more than thirding or the acceleration towards Ethereum 2.0. The platform is not surprising attractive to developers.
Candlestick Arrangement
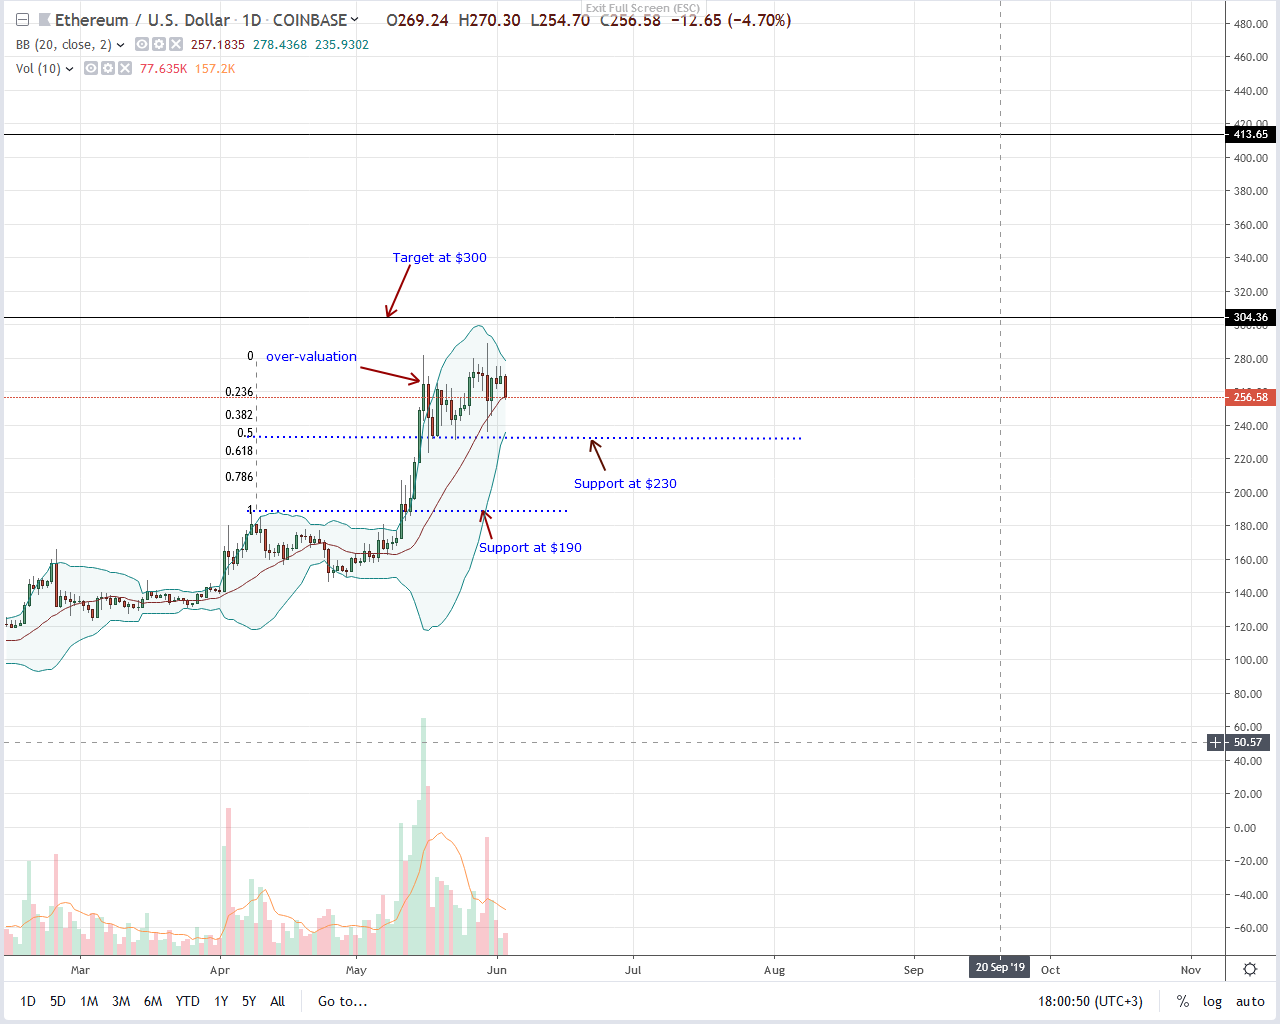

There is resistance for higher highs. In the last day, ETH is down 3.7 percent, reacting from $290 as sellers appear to press lower, forcing liquidation. For bulls to cement their position, then it is vital for prices to break free from the current consolidation, preferably at the back of high trading volumes.
In a breakout, there will be an impetus for more upsides. In that case, the possibility of ETH clearing $400 or higher by the end of the quarter will be on the cards. Since prices are oscillating inside May 30th trade range, sellers are temporarily in charge from an effort versus result point of view.
It all depends on what happens in the next few days now that support is at $230 or the 50 percent Fibonacci retracement level of May trade range. Any breach will surely confirm bears of May 30th, and in a trend continuation, ETH prices could crumble to $170.
Technical Indicator
In light of the above, May 30th candlestick will anchor this trade plan. It has above average trading volumes of 410k against 191k. As aforementioned, any drop or surge above $230 or $300 nullifying or confirming this trade position ought to be with high trading volumes exceeding 410k.
Chart courtesy of Trading View. Image Courtesy of Shutterstock