Reason to trust
How Our News is Made
Strict editorial policy that focuses on accuracy, relevance, and impartiality
Ad discliamer
Morbi pretium leo et nisl aliquam mollis. Quisque arcu lorem, ultricies quis pellentesque nec, ullamcorper eu odio.
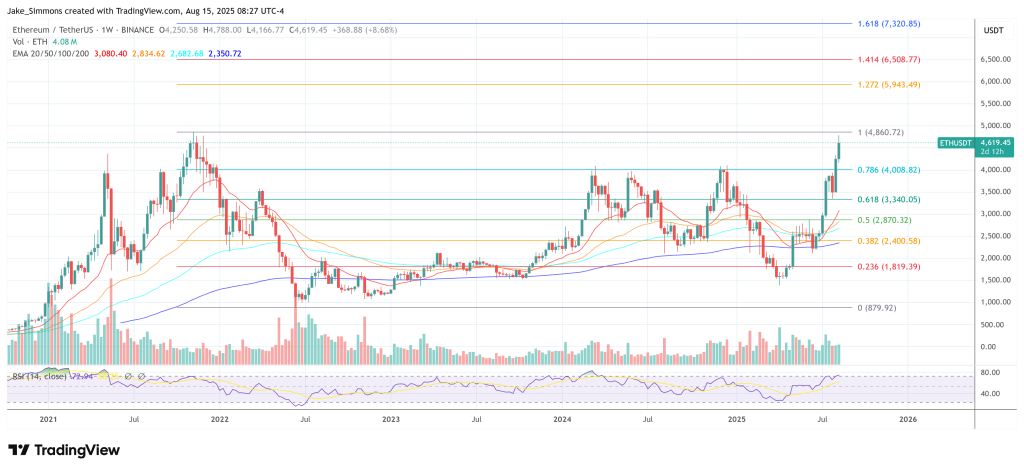
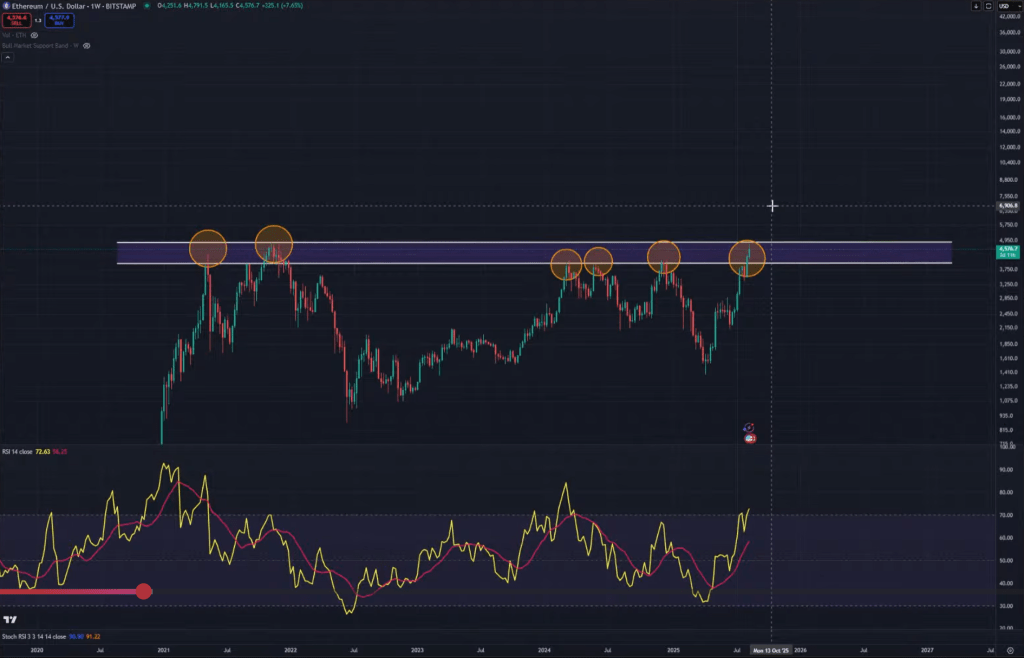
Ethereum has run straight into its four-year ceiling, with price action pressing the $4,700 band that Kevin (@Kev_Capital_TA) repeatedly calls “the level that decides everything.” His latest broadcast frames ETH’s setup as binary: either a decisive break through this resistance — confirmed by a clean weekly close and a break of the down-trending weekly RSI line — or another rejection that extends a months-long pattern of weakening rallies.
Ethereum Teeters at $4,700 — Breakout Oor Bloodbath?
“The catch-up is over,” Kevin said, noting ETH has “finally caught up to basically where Bitcoin is at… it’s at its major resistance.” In his read, the $4,700 area is not a single tick but a supply zone defined by the prior cycle’s peak and reinforced by a “weekly downtrend on the RSI” that has capped every advance since early 2024. “Break resistance and the real bull will begin,” he added. Until that happens, he characterizes this band as the “line in the sand.”
Momentum into the test was real. Kevin described money flow improving and “nice patterns forming on some altcoins” — including “textbook inverse head and shoulders” — before the follow-through failed and ETH stalled right at resistance. He pointed to the Asia session’s lack of continuation and, more forcefully, to a macro surprise that hit as the market was leaning long.

That shock was the US Producer Price Index. “The PPI came in significantly hotter than expected,” Kevin said, emphasizing both the magnitude and where the pressure showed up: month-over-month +0.9% versus +0.2% expected, year-over-year 3.3% versus 2.5%, with core PPI +0.9% m/m versus +0.2% and 3.7% y/y versus 3.0%.
In his view, this reflects tariff-driven costs being “brunted by the producer,” which is why the spike surfaced in PPI rather than CPI. The open question — and the risk to ETH at resistance — is whether those costs “trickle into the CPI” and, by extension, PCE. He underscored how quickly rate-cut probabilities whipsawed on the FedWatch tool intraday: September still heavily favored, October largely intact, and December “pricing out a third rate cut” before flipping back toward it as the day progressed. “This has been volatile this morning… let it settle out,” he cautioned, adding that next week’s Jackson Hole remarks from Chair Powell are the next major macro catalyst.
Technically, Kevin’s checklist for Ethereum does not change with one data print. He stresses two confirmations: take out the horizontal supply around $4,700 with authority and “break the weekly downtrend on the RSI” to nullify the bearish divergence that has persisted since Q1 2024. “Resistance is resistance until it’s not,” he said. Fail there, and ETH risks another corrective leg as late longs are forced out at the worst possible spot. Succeed, and “the entire conversation changes,” opening a path to what he calls a “real bull” in ETH and, by knock-on effect, in the broader alt market.

He ties ETH’s fate to broader market structure without diluting the focus. Total2 — his ETH-plus-alts proxy — “came up to 1.69 trillion” against a well-telegraphed breakout trigger at “1.72 trillion,” while tapping its own weekly RSI downtrend. The inability to push that last few dozen billions alongside the PPI shock explains the abrupt reversal across ETH and alts. Kevin also flagged stablecoin dynamics and seasonal liquidity as background variables, noting USDT dominance remains elevated and that September “usually” isn’t a great month as traditional funds return from summer, manage taxes, and prepare for Q4 risk.

Operationally, he argues that the right trade location was behind us, not at resistance. “There’s no reason to be buying up in these crazy levels,” he said, advising patience for anyone positioned from lower. His framework is simple and strict: watch the weekly ETH chart, the $4,700 band, and the RSI trendline. If macro “stays steady,” he expects the break; if it deteriorates, he’ll reassess. Either way, the pivot won’t come from lower-timeframe noise but from ETH finally resolving its four-year wall.
“Focus on these charts and nothing else,” Kevin concluded. For Ethereum, that means one test, one level, and one signal: clear $4,700 and retire the divergence — or wait.
At press time, ETH traded at $4,619.