
Reason to trust
How Our News is Made
Strict editorial policy that focuses on accuracy, relevance, and impartiality
Ad discliamer
Morbi pretium leo et nisl aliquam mollis. Quisque arcu lorem, ultricies quis pellentesque nec, ullamcorper eu odio.
Ethereum failed again to settle above the $1,300 resistance against the US Dollar. ETH is moving lower and might soon test the $1,220 support zone.
- Ethereum attempted another upside break above $1,300, but failed.
- The price is now trading below $1,280 and the 100 hourly simple moving average.
- There was a break below a key bullish trend line with support near $1,272 on the hourly chart of ETH/USD (data feed via Kraken).
- The pair could correct further lower, but the $1,220 support is the key.
Ethereum Price Corrects Lower
Ethereum price made another attempt to surpass the $1,300 resistance zone. However, ETH struggled to gain momentum above the $1,300 level. A high was formed near $1,304 and the price started a downside correction, similar to bitcoin.
The price declined below the $1,280 support zone and the 100 hourly simple moving average. Besides, there was a break below a key bullish trend line with support near $1,272 on the hourly chart of ETH/USD.
Ether price traded as low as $1,248 and is currently consolidating losses. There was a minor increase above the $1,260 level. The price climbed above the 23.6% Fib retracement level of the recent decline from the $1,304 swing high to $1,248 low.
An immediate resistance on the upside is near the $1,270 level and the 100 hourly simple moving average. The first major resistance is near the $1,275 level. It is near the 50% Fib retracement level of the recent decline from the $1,304 swing high to $1,248 low.
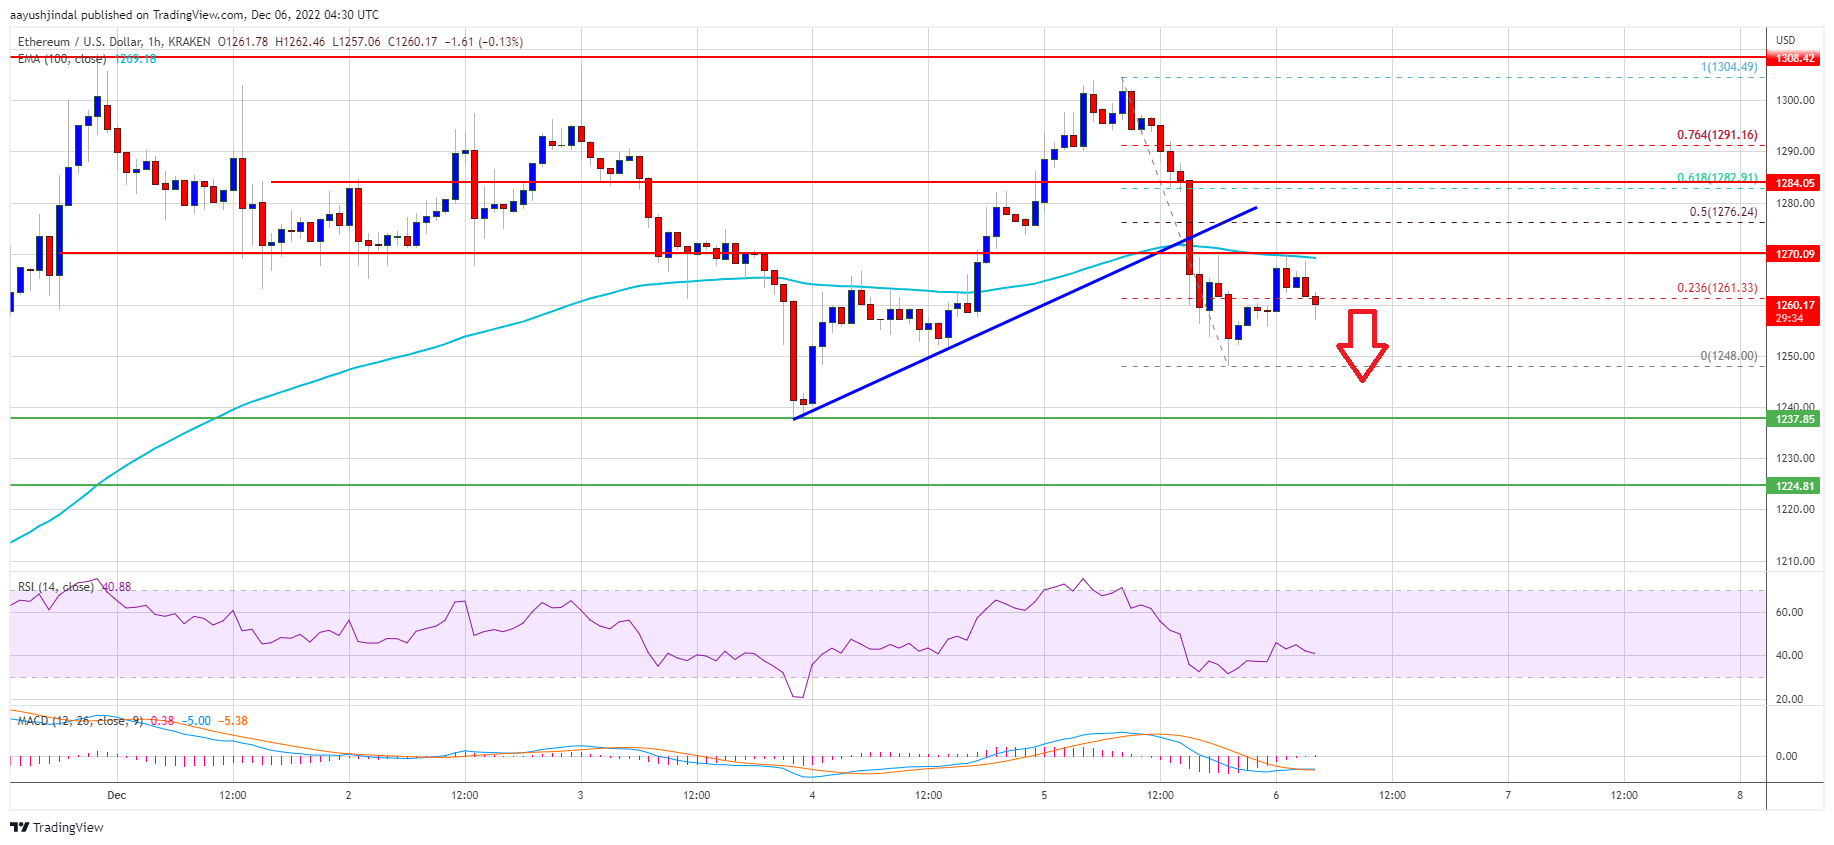
A close above the $1,275 resistance might send the price further higher. The next major resistance is near the $1,300 level, above which ether price might test $1,320. Any more gains might send the price towards the $1,400 resistance zone.
Retest of a Key Support by ETH?
If ethereum fails to start another increase above the $1,275 resistance, it could continue to move down. An initial support on the downside is near the $1,250 level.
The next major support is near the $1,220 level. If there is a break below $1,220, the price could test the $1,165 support. Any more losses could lead the price towards the $1,100 support.
Technical Indicators
Hourly MACD – The MACD for ETH/USD is now gaining momentum in the bearish zone.
Hourly RSI – The RSI for ETH/USD is now below the 50 level.
Major Support Level – $1,220
Major Resistance Level – $1,275
Featured image from iStock


