

Exactly four weeks since Bitcoin split into bitcoin and bitcoin cash, the original digital currency hit a record high versus the US dollar on Tuesday, while the offshoot fell to its lowest in more than a week. Now the question is whether or not we could see a BTC/USD pullback after this surge.
When Bitcoin and other cryptocurrencies first make an appearance a few years ago, many people — including myself– dismissed them as a fad. But now, here we are, with an estimated 5 to 10 million unique active users of crypto currencies. Now BitCoin has even found a way in the luxury market. Some people are buying goods and services with Bitcoin, but many are simply holding it as an asset, like gold or art.
One could say Bitcoin may have turned into a safe haven; a precautionary trade which investors trade under heightened uncertainty. The ultimate safe haven trade for investors has been gold, however, Bitcoin also stands tall in that basket. The acceptance of Bitcoin has been phenomenal especially this year
With that, it is no surprise that we saw yet another surge of BTC versus the USD on Tuesday, hitting a record high near $4,700. This comes after Litecoin hit an all-time high versus the US dollar on Monday.
Technical Points
While BitCoin has generally been growing in price, hitting an all-time high does not mean that we won’t see a retracement in the near future.
BTC/USD has continued its journey above the daily Ichimoku cloud since it broke above it in July. In most other time-frames longer than the 4-hour chart, the cryptocurrency hasn’t really lasted below the cloud, which is an unlikely behavior for a currency pair. With this, even the technical analysis indicates that the Bitcoin market participants are viewing it more as an asset rather than a day-trading opportunity.
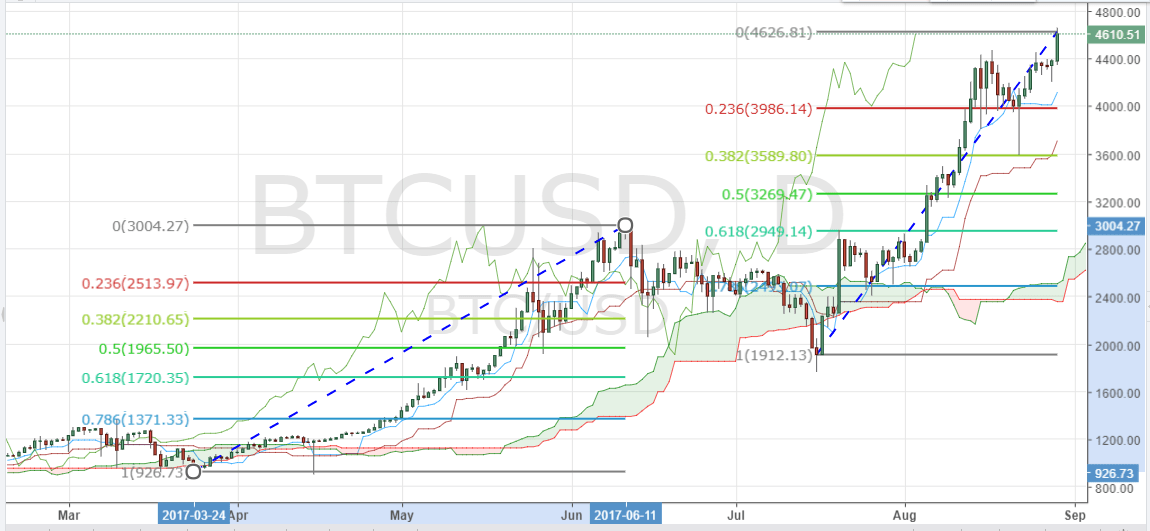

Analyzing the daily chart, the key level that BTC/USD could most likely fall back to before further hikes, is the 23% Fibonacci retracement and key support level of 4,000. In the past, BTC/USD has retraced all the way back to the 50% Fibonacci level so if history is bound to repeat itself, a temporary pullback towards 3,250 is also possible. Long term investors could take advantage of these pullbacks to grow their portfolio.
BTC/USD mostly consolidated after the surge on the hourly chart. This indicates indecisiveness in the market for now as the volatility has also cooled down.
Here are calculations for important approximate levels to keep an eye on:
Support Levels: $3250, $3589
Turning Points: $4000, $4463
Resistance Levels: $4626, $4900