

Starting from today, I will be posting a daily litecoin price technical analysis, so I guess it’s better to establish key resistance and support levels that will be a base for our future analyses during the upcoming couple of weeks.
Litecoin price increased to score a high of $2.04 yesterday, before dropping to a low of $1.79. By examining the 1 hour (LTC/USD) and (BTC/USD) charts, we can clearly see that litecoin price is mirroring what is happening on the bitcoin charts.
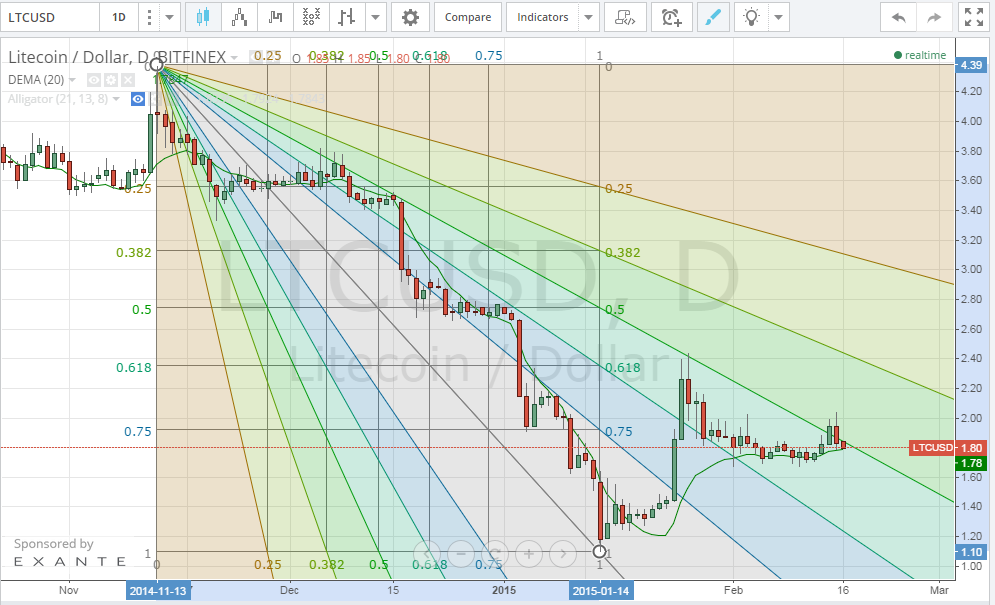
By studying the 1 day Bitfinex (LTC/USD) chart from tradingview.com and plotting the Fibonacci retracement fan along a trend line that extends between the high reached on the 13th of November ($4.36) and the low reached on the 14th of January ($1.09) (look at the below chart), we can better evaluate resistance and support levels. The price is now trading at a price below the 20 day EMA. Litecoin price is now touching the 50% Fibonacci resistance fan level, so if it increases above 1.85, we can see it increase to $2.00 within about 24 hours. According to the Fibonacci retracements we plotted, we can notice that the next resistance level will be at $2.35 which coincides with the 62% retracement level.
By studying the litceoin 4 hour Bitfinex (BTC/USD) charts from tradingview.com and plotting the William’s Alligator indicator accordingly, we can see that the litecoin price is facing support at around $1.9 which is expected to prevent a further drop. William’s Alligator alignment of moving averages is not in favor of a reverse in the downtrend, so we expect to see a different alignment of these moving averages before an uptrend can be noticeable.

Conclusion:
Today’s litecoin price drop seems to be ignited by the decline in bitcoin price. It seems that we will have to wait for at least 24 hours before we can see a reverse in this downtrend.
Charts from Bitfinex