Litecoin price failed to rise above $2.00 on its way up to test the resistance at $2.35, which corresponds to the 62% Fibonacci retracements that we plotted throughout our yesterday’s analysis.
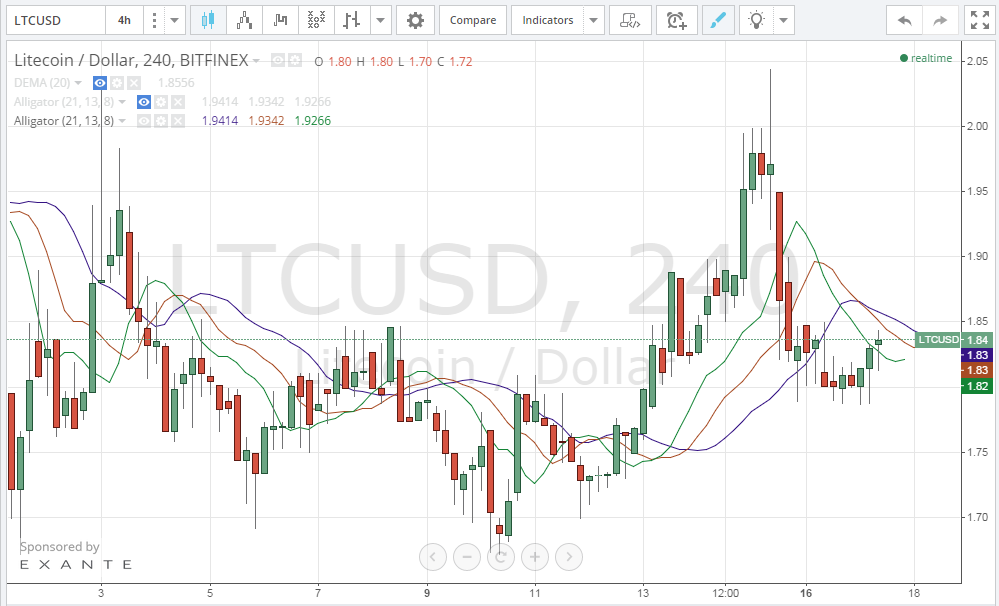
By studying the 4 hour Bitfinex (LTC/USD) charts from tradingview.com and plotting the William’s Alligator indicator accordingly, we can notice how the $1.80 support level seems to be resisting a further drop in litecoin price as shown by the long downwards shadows of the candlesticks (look at the latest 3 green bullish candles on the below chart). Although the alignment of the William’s Alligator moving averages is not perfect for an upcoming bullish wave, it will probably change as the trading volume rises throughout the day.
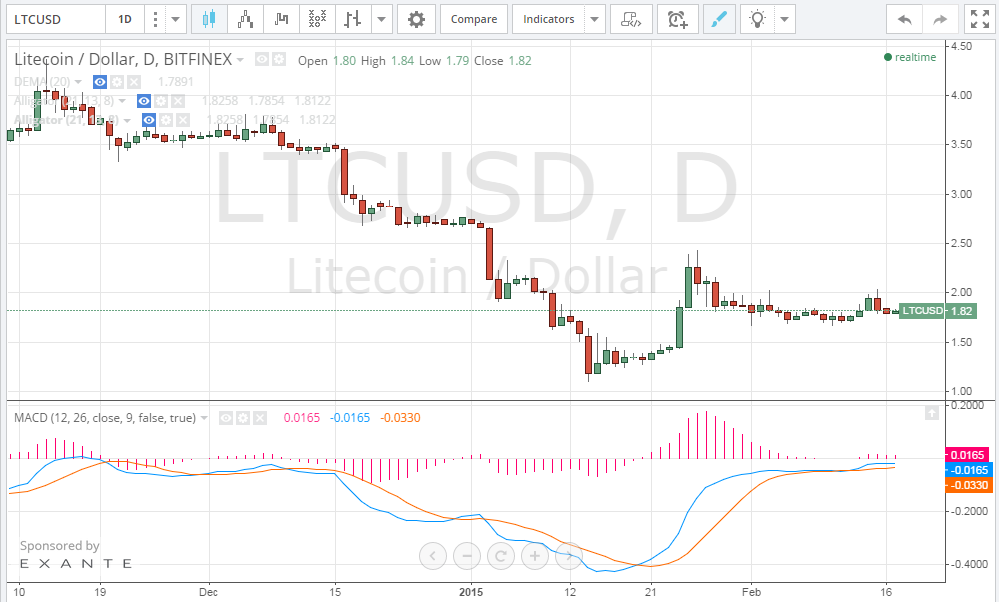
By studying the 1 day Bitfinex (LTC/USD) charts from tradingview.com and plotting the MACD indicator accordingly, we can see how litecoin price has been moving sideways to the $1.85 support level since the 28th of January. By analyzing the MACD indicator we can conclude that conditions are in favor of a rise in litecoin price that can push the price above $2.00 within the next 24 hours, as shown by:
- The MACD blue line has crossed over the red signal line.
- The MACD indicator is sloping in an upwards direction.
- Although the MACD is still in the negative territory, it seems to be crawling slowly towards the positive territory, which would signal a strong bullish rally.
Conclusion:
Litecoin price failed to rise above $2.00 yesterday. However, analyzing the charts shows multiple signs that signal an upcoming bullish wave that can push the price above $2.00, so we can see the $2.35 resistance level tested very soon.