Litecoin price advanced slowly yesterday towards the north to score a high of around $1.90 on its way to the $2.35 resistance level. It seems that the bullish wave is going to continue on today to attempt to test the 62% Fibonacci retracement level at $2.35.
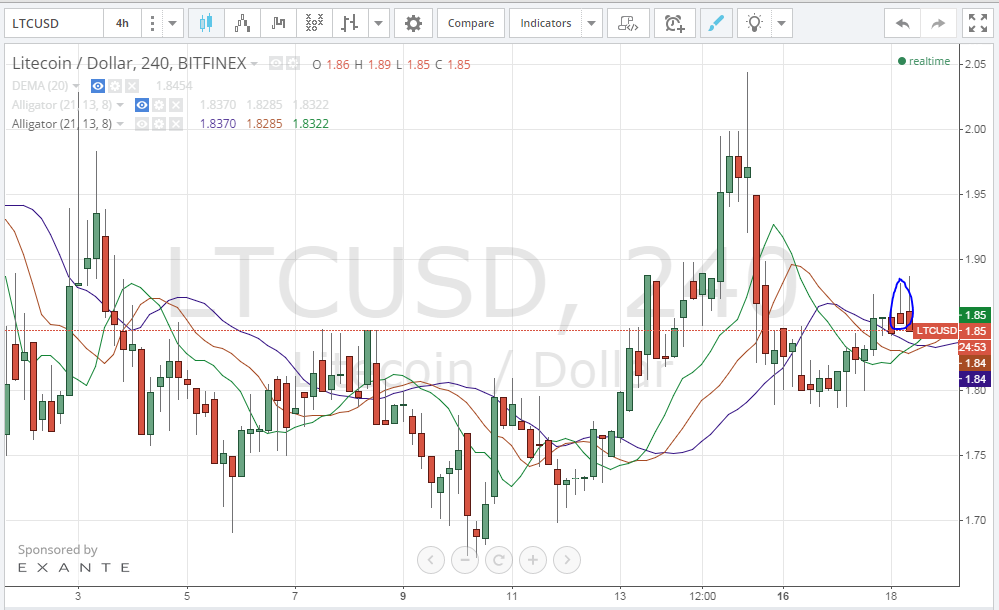
By studying the 4 hour Bitfinex (LTC/USD) charts from tradingview.com and plotting the William’s Alligator indicator accordingly (look at the below chart), we can better understand the pattern of the uptrend that was ignited on the 16th of January. The following can be observed by studying the chart:
- The moving averages of the William’s Alligator indicator are aligned perfectly in favor of continuation of the bullish wave; the blue line (lips) is below, the green line (jaw) is on top and the red line (teeth) is in the middle.
- The “gravestone” candlestick on the 4 hourly chart (look at the candlestick inside the blue cloud on the below chart) might signal slowing down of the bullish rally or even its reversal, so investing in long positions should be withheld until the price increases above $2.00, where “take profit” can be set at $2.35 and “stop loss” adjusted to $1.8.
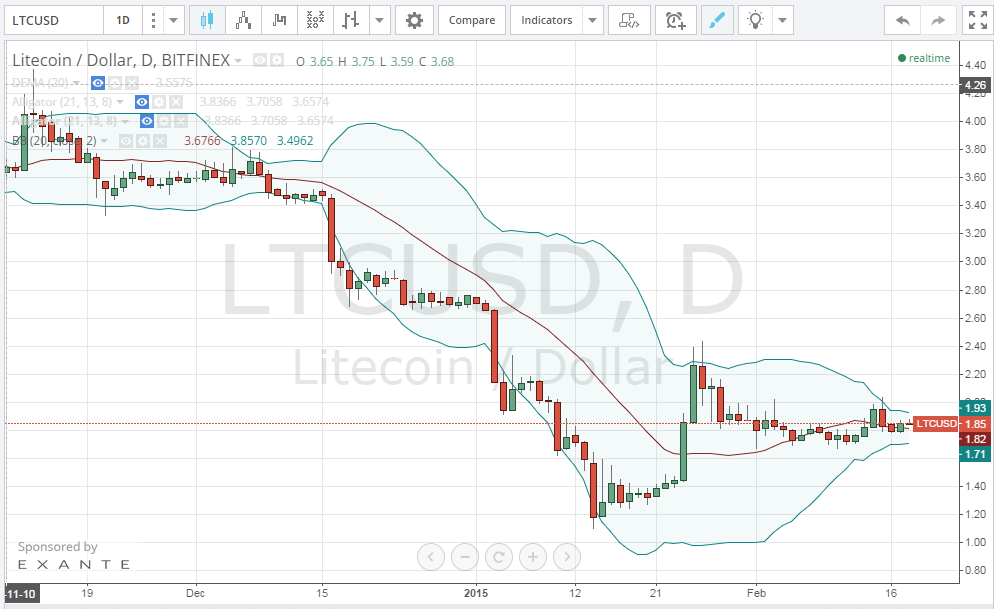
By analyzing the 1 hour Bitfinex (BTC/USD) chart from tradingview.com and plotting the Bollinger bands accordingly (look at the below chart), we can notice that litecoin price is now above the 20 day EMA, but below the upper band (1 standard deviation above the 20 day EMA), which is in favor of continuation of the current uptrend. Whenever the price touches the upper Bollinger band, chances of a bearish reversal rise.
Conclusion:
Litecoin price is advancing slowly towards the $2.35 resistance level. Although our technical analysis is in favor of a continuation of the current uptrend, care must be taken to spot early signs of bearish reversal as we explained.