Litecoin price went south yesterday, as signaled by the “gravestone” candlestick on yesterday’s analysis, to reach a low of around $1.8 before rising up again to reach $1.85 at the time of writing of this article.
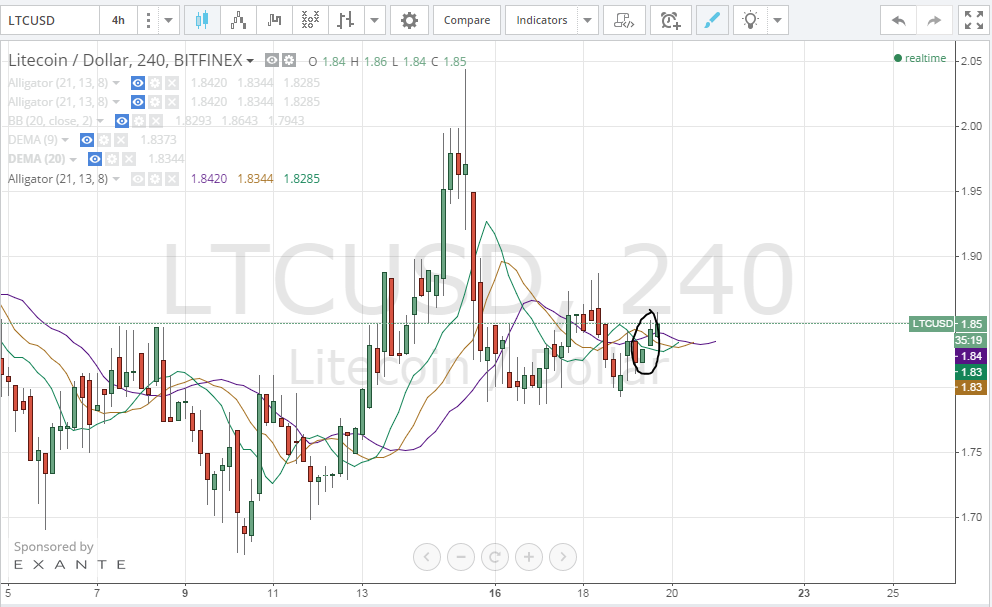
By studying the 4 hour Bitfinex (BTC/USD) charts from tradingview.com and plotting the William’s Alligator indicator (look at the below chart), we can notice the following:
- Litecoin price fell yesterday to around $1.8 before rising up again to record 3 successive bullish candles on the 4 hour charts, which seems to be mirroring what is happening on the (BTC/USD) charts.
- We can notice a variation of the “gapping plays” candlestick sign on the 4 hour charts (look at the 2 bullish candles inside the black cloud on the below chart) which might mean that the market’s buying power is strong enough to push the price to higher levels.
- The moving averages of the William’s Alligator indicator are still not aligned perfectly for a strong bullish rally, yet it seems that within the next few hours that the red line will cross above the blue line and the green line will cross above both; such alignment will mean that we can see litecoin price at $2.00 soon enough.
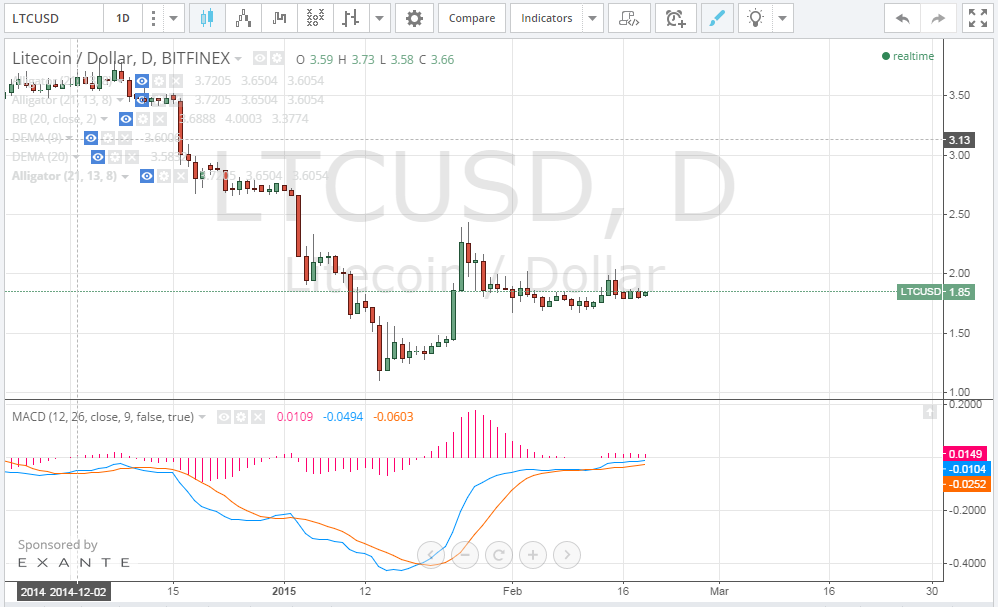
By studying the 1 day Bitfinex (LTC/USD) charts from tradingview.com and plotting the MACD indicator accordingly (look at the below chart), we can see the MACD blue line crossing above the red signal line, yet the MACD’s values is still in the negative territory. If the MACD’s value enters the positive territory within the next few hours, we can expect a bullish wave soon.
Conclusion:
Litecoin price dropped yesterday to around $1.8, but it began rising again today. Our technical analysis predicts a bullish wave soon, but we advice withholding investing in long positions until the price exceeds $2.00.
Charts from Bitfinex