Litecoin price ranged between $1.78 and $1.83 throughout yesterday’s trading sessions. The upcoming few hours are rather critical and will decide whether or not litecoin price will rise to test the next resistance level at around $1.93, especially that (BTC/USD) charts also seem indecisive at the moment.
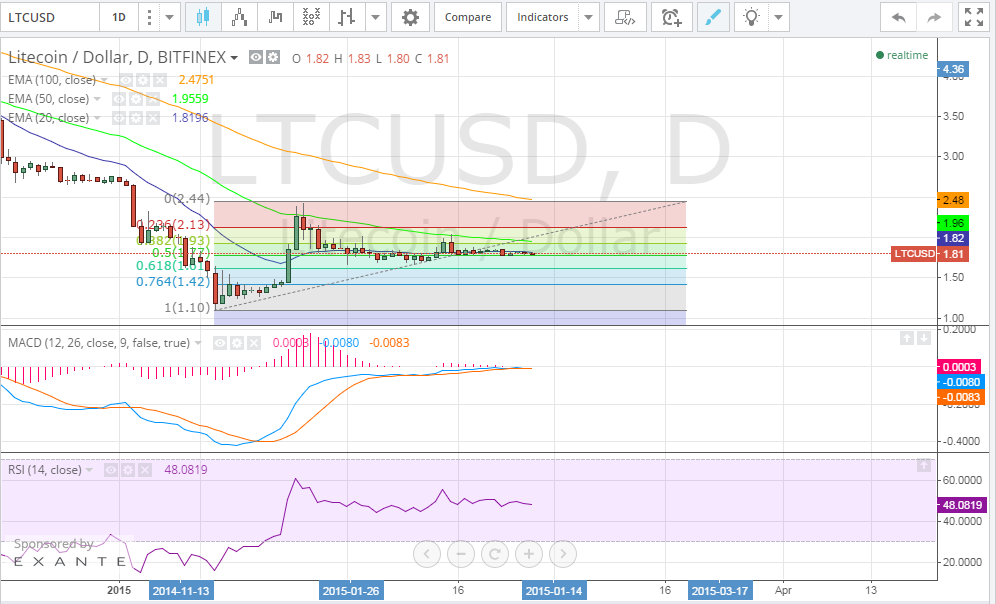
By studying the 1 day Bitfinex (LTC/USD) charts from tradingview.com, plotting the 20 day EMA (blue), the 50 day EMA (green) and the 100 day EMA (orange), calculating the RSI and executing the MACD indicator, we can conclude the following:
- We can draw Fibonacci retracements across a trend line that extends between the low reached on the 14th of January ($1.1) and the high reached on the 26th of January ($2.45). Accordingly, we can conclude that litecoin price is now trading between resistance at $1.93 which coincides with the 38% Fibonacci retracement level and support at $1.78 which coincides with the 50% Fibonacci retracement level.
- The price now is well below the 50 and 100 day EMAs and trading almost sideways to the 20 day EMA, which reflects the current bearish trend of the market that is also consistent with the “triangle” pattern we spotted during our bitcoin technical analysis for today.
- The MACD indicator shows no signs of a bullish break out soon and the values of the RSI can’t also point to the direction of the upcoming trend.
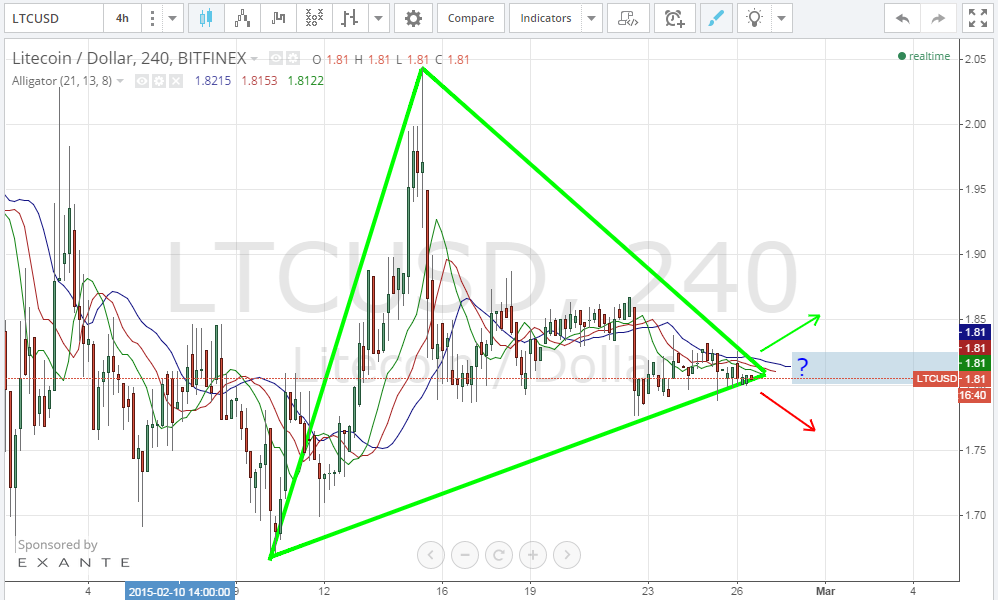
By studying the 4 hour Bitfinex (LTC/USD) charts from tradingview.com and plotting the William’s alligator indicator accordingly (look at the below chart), we can notice the following:
- Since the 10th of February, litecoin price has traded along a triangle like pattern that is somehow similar to what we spotted on bitcoin’s charts. At the moment, it seems that the pattern is complete and the following few hours will decide whether or not the price will head to the bullish side.
- The alignment of the moving averages of William’s Alligator indicator isn’t in favor of an upcoming bullish wave.
Conclusion:
Litecoin price has formed a triangle like trend pattern that is similar to what we spotted across bitcoin’s charts. The upcoming few hours will help us decide which direction the price will head to during the upcoming days, although it is rather unlikely to see it go to the bullish side.
Charts from Bitfinex