Litecoin price rallied earlier today to record a high of around $1.89. This bullish wave coincided with today’s rise in bitcoin price. The price is now about to test the resistance at $1.93 which coincides with the 38% Fibonacci retracement level as we showed on yesterday’s analysis.
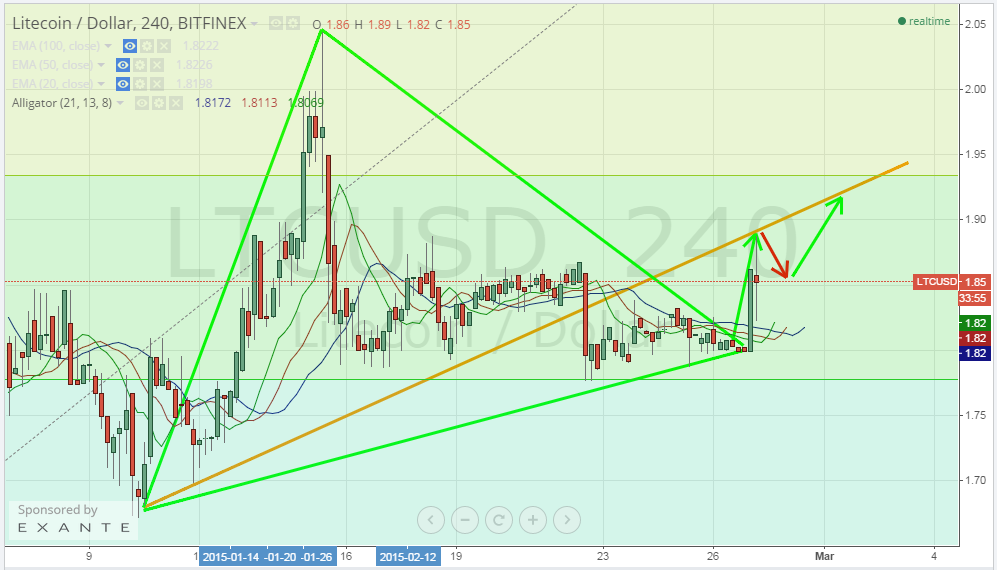
By studying the 4 hour Bitfinex (LTC/USD) chart from tradingview.com, drawing the “triangle” like pattern we spotted during yesterday’s analysis and plotting the William’s Alligator indicator accordingly (look at the below chart), we can conclude the following:
- After completion of the triangle pattern trend yesterday, litecoin price decided to go north recording a high of $1.89 a few hours before this article was written.
- Price correction will likely pull the price downwards to an average of 50% of the recent rise at around $1.85 before rising again to approach the 38% Fibonacci retracement level.
- The alignment of the moving averages of the William’s Alligator indicator signals continuation of the bullish wave as the blue line (lips) is below the red line (teeth) and the green line (jaw) is on top of both, so we can see the price rise to $1.93 within the next 24 hours.
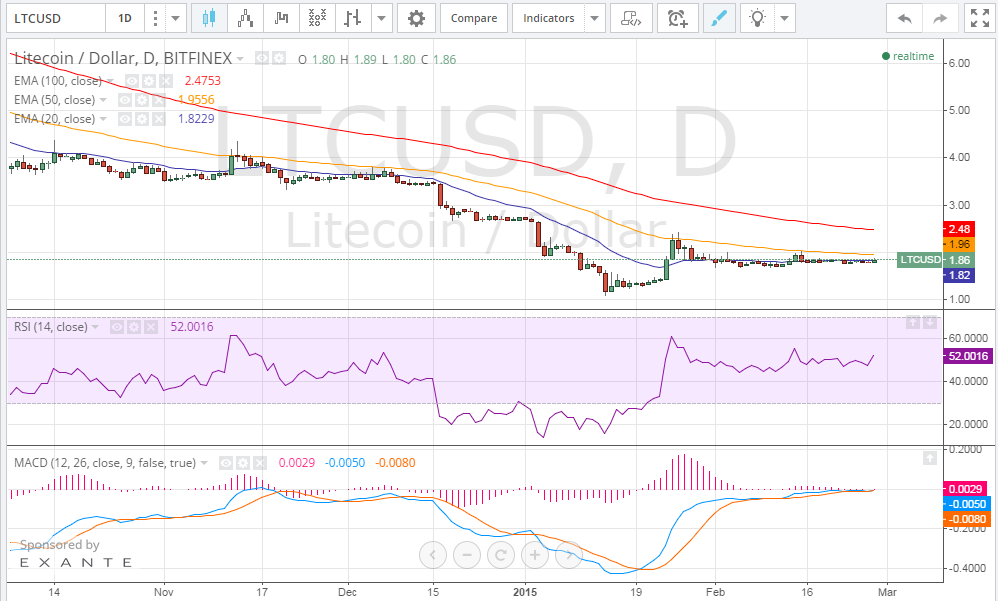
By studying the 1 day Bitfinex (LTC/USD) chart from tradingview.com, plotting the 20,50 and 100 day EMAs, calculating the MACD indicator and executing the RSI (look at the below chart), we can notice the following:
- The RSI is now around 52 so we can still see the price reach higher levels as the bullish wave seems not to be over. Keep an eye on the RSI because if it’s value exceeds 70, this will signal reversal of the bullish trend.
- The MACD is in the negative territory yet it is very close to zero. The blue MACD line and the red signal line have converged. As the MACD value enters the positive territory and the blue line crosses above the red signal line, this can signal strengthening of the bullish wave.
Conclusion:
Litecoin price increased today to score a high of $1.89. Our technical analysis anticipates continuation of the bullish wave so we can see the $1.93 resistance level tested soon.
Charts from bitfinex