Litecoin price dropped yesterday to print a low of around $1.91. The downtrend continued to pull the price downwards earlier today to reach $1.89 an hour or so ago. Technical analysis of the charts shall help us predict whether or not the new month’s bullish wave will resume taking upper hand during the next 24 hours.
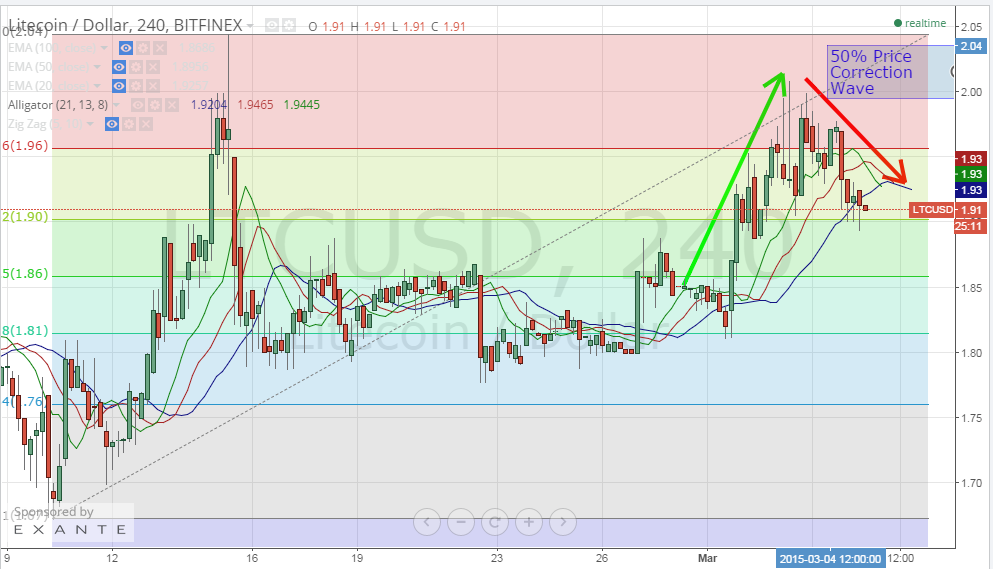
By examining the 4 hour Bitfinex (LTC/USD) charts from tradingview.com, plotting William’s Alligator indicator and drawing Fibonacci retracements across a trend line that extends between the low printed on the 10th of February ($1.67) and the high reached on the 15th of February ($2.04) (look at the below chart), we can notice the following:
– Although the new bullish wave took the price up to $2.01 to break through the 23.6% Fibonacci retracement level, it fell again to around $1.89 earlier today. This downwards movement could be a 50% price correction wave especially that the 38.2% Fibonacci retracement level at $1.89 seems to be supporting price well as shown by the long downwards shadows of the candlesticks on the 4 hour charts.
– We predict the price to resume rising after testing the $1.89 support level, yet we have to see a “bullish alignment” of William’s Alligator’s SMAs before the bullish wave continues to push the price to higher levels.
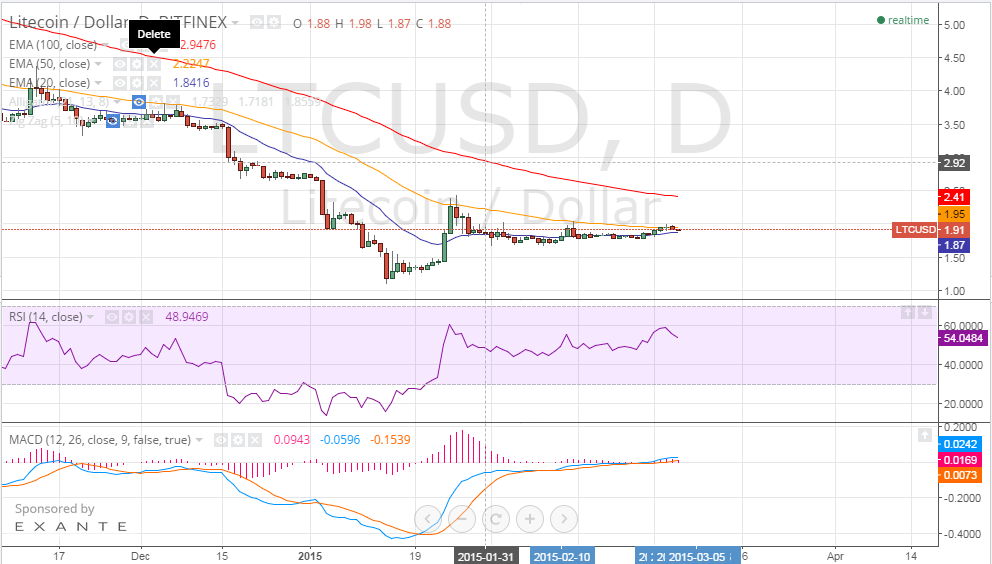
By studying the 1 day Bitfinex (LTC/USD) charts and plotting the RSI and MACD indicator (look at the below chart), we can notice the following:
– The RSI values around 54 now yet it is not sloping in an upward direction. Accordingly, litecoin isn’t overbought now and we can see it rise again.
– The MACD indicator is in the positive territory and the blue MACD line has crossed above the red signal line so we can see the price rise within the next 24 hours.
Conclusion :
Litecoin price dropped earlier today to around $1.89. Our technical analysis is in favor of resumption of the bullish wave to push the price to higher levels again.
Charts from Bitfinex