Continuing on its way up, Litecoin fell from resistance to support, in a fashion similar to Bitcoin. In my previous analysis titled, At June’s High, it was discussed that Litecoin could accumulate more gains as the bulls looked confident of tightening the noose on the bears. Litecoin did rise up to $1.840 but has erased the gains and approached the support level, providing yet another opportunity for the buyers.
Litecoin is currently trading just marginally up from yesterday’s $1.797 to present $1.801.
Technically, things look highly comforting for the buyers but they must not weaken their hold.
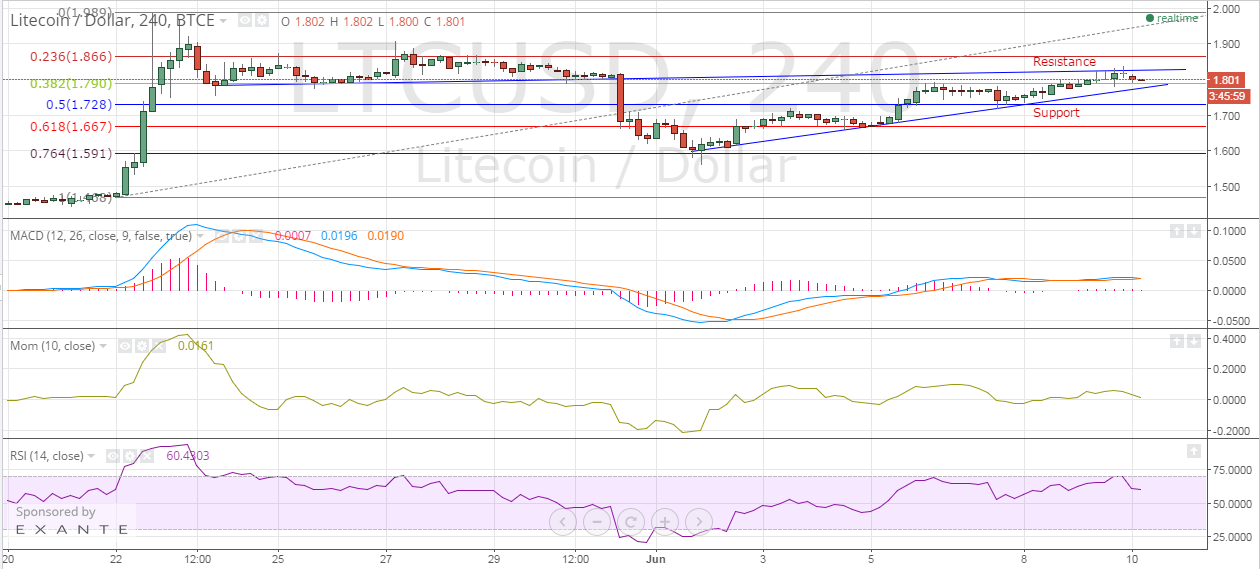
Bitcoin Chart Structure – Bitcoin extends its upward march following a clear higher top, higher bottom structure. As the price comes down, bulls will look to buy near the support level which comes in at $1.770. For hefty gains, the cryptocurrency must close and sustain above $1.825.
Fibonacci Retracements – At the current level, Bitcoin will also receive support from the 38.2% Fibonacci retracement level of $1.790.
Moving Average Convergence Divergence – The MACD and the Signal Line remain closely stuck and hold the Histogram value in the positive region. The MACD indicator and the Signal Line have values of 0.0196 and 0.0190 respectively while the Histogram is barely positive at 0.0007.
Momentum – The 10-4h Momentum indicator has managed to hold on its positive value even as the price declines. The latest value is 0.0161.
Relative Strength Index – The RSI indicator has eased once again from overbought levels to 60.4303. This value is still strongly in favor of the buyers.
Conclusion
The chart structure and the technical indicators do not call for a bearish price action yet. Instead, Litecoin should be bought if the price were to fall to $1.790, however, a stop-loss must be placed in order to avoid any huge loss. Above $1.825, the price may head up to $1.900.