

Litecoin is currently stabilizing above the crucial support of $4.100, a day after witnessing a terrifying cut of more than 50 percent from its peak value of $8.650. Litecoin is trading down 5.60 percent at $4.550.
I had earlier mentioned that more pain will come to the buyers if the previous consolidation level of $4.100 is breached. Updating my view, I think that it will be breached!
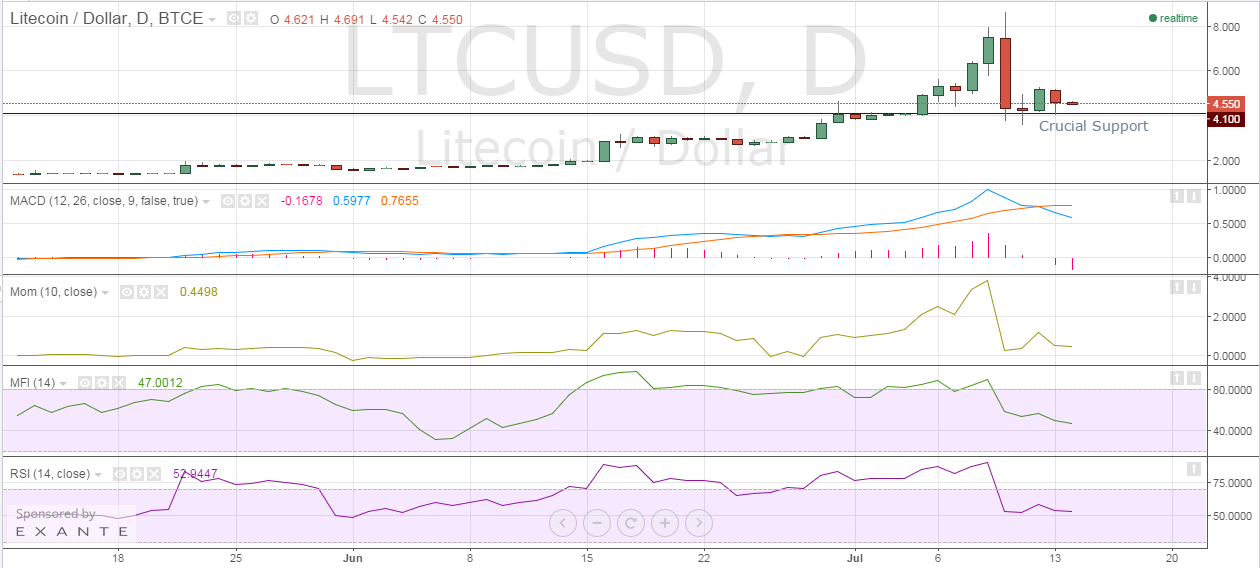
Image: https://www.tradingview.com/x/CuRfXFTJ/
Taking a technical look at the Daily LTC-USD price chart, it seems that that the market has been shaken to the core. But it’s very understandable considering the magnitude of the crash that rocked the market. The bigger question now is: Will the market be able to recover from this catastrophe or will it go downward?
Litecoin Chart Structure – Litecoin has been repeatedly testing the support line (marked in the chart), and in the absence of buying pressure, it may well pierce it.
Moving Average Convergence Divergence – MACD continues to lose value even as the price stabilizes above the support. The MACD and the Signal Line are in the positive territory with values of 0.5977 and 0.7655 respectively.
Momentum – The Momentum indicator mirrors the price pattern and can be seen sustaining above the 0 level. The current value is 0.4498.
Money Flow Index – One thing that should be on market’s radar should be the MFI which is indicating a bearish outlook for Litecoin. The MFI is on a downward spree while the price consolidates, therefore, a negative divergence.
Relative Strength Index – The RSI value has tumbled to 52.9447 bringing the game into balance.
Conclusion
The fate of Litecoin relies on the floor of $4.100 which I think will eventually cave under pressure. Avoid creating fresh long positions and rather dump your investments while you have the chance. Look to go short on rallies by maintaining strict stop-losses.