

I will resume writing a daily LTC price technical analysis starting from today, so throughout this article, I will try establishing some key resistance and support points that would help us read through the charts and detect clues that can predict future price movements.
Last week, LTC price surged to exceed $4 on the 31st of October. The bullish wave started a day earlier than Bitcoin’s surge and Litecoin’s price rose from $3 to around $3.72 last Sunday. However, as Bitcoin’s price rose above the $340 resistance level, LTC also continues to print higher highs.
Bulls in Control On 1 Day Charts:
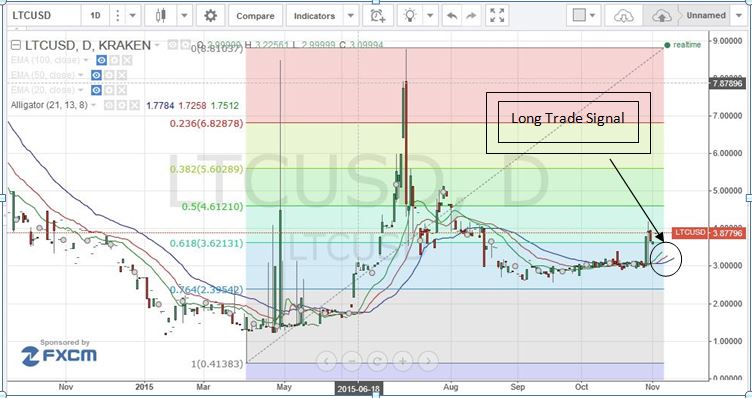
By studying the 1 day (LTC/USD) charts from Kraken (look at the below chart); plotting the William’s Alligator Indicator and plotting a Fibonacci retracement between the low scored on the 14th of May, 2015 ($0.41) and the high scored on the 10th of July, 2015 ($8.81), we can observe the following:
- Liteoin price has been rising away from the 0.764 Fibonacci retracement support level at ($2.395) since the first half of last September. Last Thursday, Litecoin price managed to break through the resistance at $3.6 which corresponds to the 0.618 Fibonacci retracement level.
- By plotting William’s alligator, we can detect a bullish signal. William’s Alligator includes 3 short term moving averages:
1- the 13 period MA displaced by 8 periods into the future (blue line).
2- the 8 period MA displaced by 5 periods into the future (red line).
3- the 5 period MA displaced by 3 periods into the future (Green line).
As shown by the circle engulfing the 3 trend lines of William’s Alligator on the below chart, we can spot a long trade signal as the green line is above the red line and the blue line is below the red line. Accordingly, this anticipates continuation of the bullish wave so we can see price rises towards testing the 0.5 Fib retracement level at $4.6 within the next week.

Price Correction vs Uptrend:
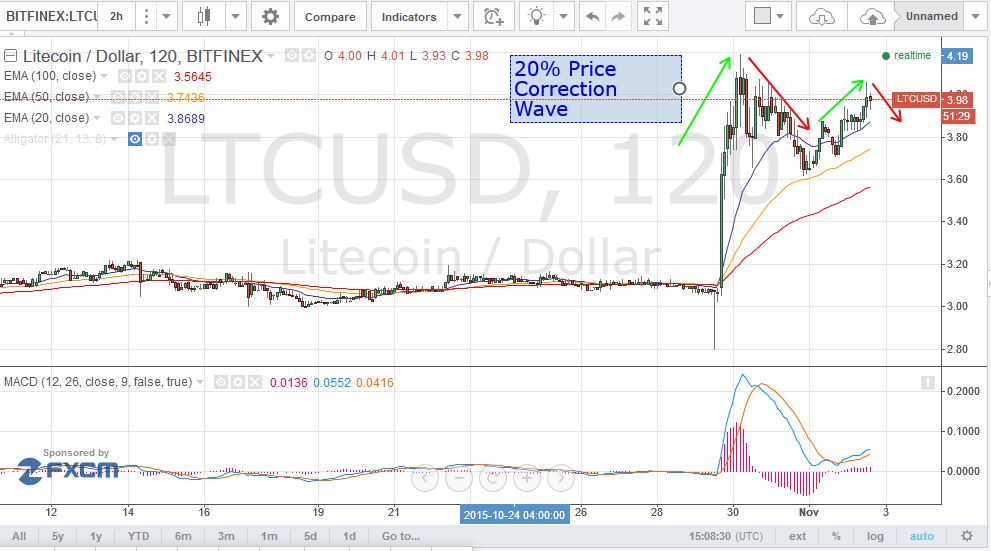
By analyzing the LTC/USD charts from Bitfinex; plotting the 100, 50 and 20 EMA; and executing the MACD indicator (look at the below chart), we can conclude the following:
- After the price topped $4.1 on Friday, a downtrend price correction wave pulled the price down to around $3.65 before the bulls took over again and higher high were printed again.
- The price is now above the 20, 50 and 100 EMAs which signals continuation of the bullish wave.
- The MACD indicator is in the positive territory and the blue trend line is above the red trend line which confirms the current bullish wave.

Conculsion:
Litecoin price is still rising and our analysis predicts a continuation of the bullish wave which is advancing synchronously with bitcoin’s bullish wave. Although price correction may take the price down again to $3.85, analysis of the charts signals continuation of the bullish wave so we can see the price approach the $4.6 resistance level soon.
Charts from Kraken and Bitfinex; hosted by Tradingview.com