In yesterday’s analysis entitled Bulls Rise, Challenge Resistances, I mentioned that Litecoin was challenging a key resistance level of $1.865. As of today, the cryptocurrency has failed to edge above this level and has come down to $1.852 as minor profit booking is witnessed.
Below has been presented the technical considerations which traders must take into account before making fresh trades or deciding on existing ones. A 240-minute LTC/USD price chart has been used to serve the purpose.
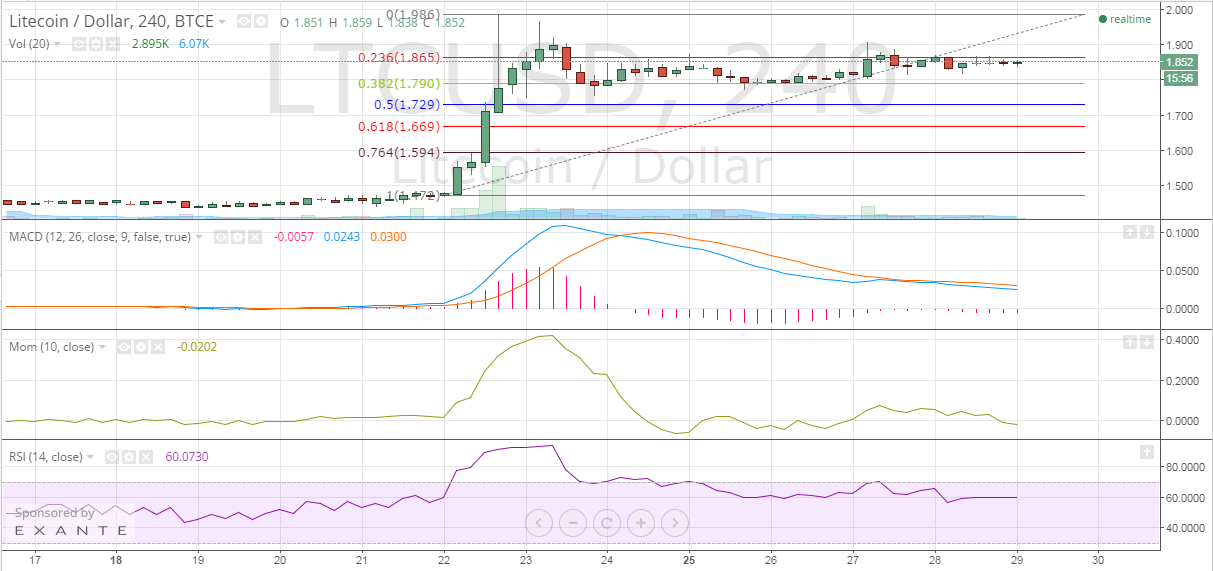
Litecoin Chart Structure – Since Litecoin is trading near the upper range of the band and refuses to retest the support, it can be said with certainty that bulls have a decisive edge over the bears.
Fibonacci Retracements – Litecoin has maintained a price band of $1.790-1.865, which correspond to Fibonacci retracement levels of 38.2% and 23.6% respectively. I am expecting the virtual currency to break out of this range in the next 72 hours, and there is a higher probability of the resistance being violated.
Moving Average Convergence Divergence – Even higher price levels have failed to arrest the slide in the MACD and the Signal Line values. The MACD indicator and the Signal Line have dropped to 0.0243 and 0.0300 respectively. As a result, the Histogram remains stuck in the negative region with a value of -0.0057.
Momentum – Profit booking has brought down the Momentum reading back into the sub-zero region; the latest value is -0.0202.
Relative Strength Index – After a brief dive into the below-60 area, the RSI indicator has jumped back to 60.0730.
Conclusion
The technical indicators provide somewhat of a mixed picture, but the chart structure clearly tells of a strong bullish action. Stay long in this counter for a target of above $2.000-levels by maintaining a stop-loss (closing basis) below the discussed support level. A breakout may be in the offing this week!