

Litecoin has jumped another 12% since yesterday, adding to its surreal gains and decimating the bears. In my previous analysis, I had recommended shorting the cryptocurrency near $5.300 by placing a stop-loss above $5.500 and Litecoin has proved me wrong.
Litecoin is currently trading up 12.41% at $5.379.
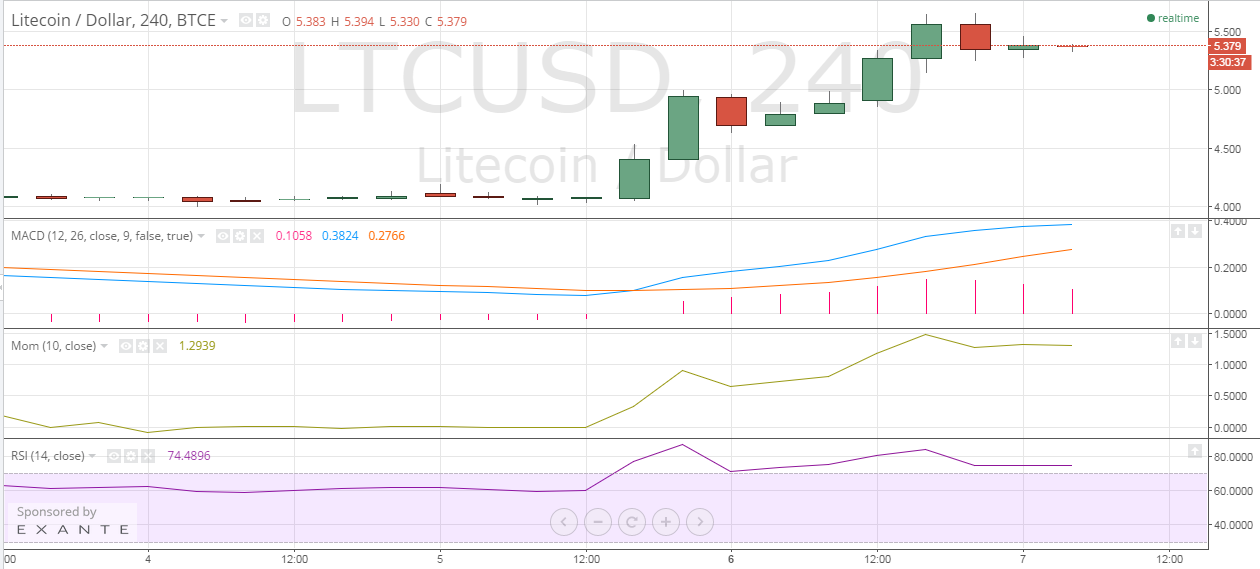
Technically, Litecoin looks formidable even at these outrageous levels. The 240-minute LTC-USD price chart indicates strong bullish force behind the rise and it has become incredibly difficult for me to comment as to when the profit booking will come in or when the market would realize its folly.
Litecoin Chart Structure – The chart above clearly tells that Litecoin is currently trading near its 10-month high of $5.680. It hit an intraday high of $5.663 before some money was taken off the table.
Moving Average Convergence Divergence – The MACD and the Signal Line extend their gains, surging to 0.3824 and 0.2766 respectively. The Histogram value inspires confidence in the underlying momentum with a value of 0.1058.
Momentum – The Momentum indicator also reflects that bullish momentum is significantly strong with a positive value of 1.2939.
Relative Strength Index – I have been iterating for long that Litecoin is extremely overbought and I firmly believe that this madness cannot end well for the cryptocurrency investors who continue to bid higher even in the absence of any positive fundamental change in the underlying. The latest RSI value also supports my view with a reading of 74.4896.
Conclusion
Litecoin remains expensive but that has failed to deter the investors and the market speculators who have lifted price to a near 10-month high. For those who are looking to buy Litecoin, I would suggest that they wait for lower and more acceptable levels. For now, there is a higher chance of losing money than making it.