

Litecoin gave us another glimpse of its highly volatile nature in yesterday’s trading session. In my previous analysis titled Sky is the limit, I had reiterated my opinion that Litecoin is expensive and should be avoided at current levels. Bullish participants may have realized the same when the cryptocurrency had a knee-jerk reaction.
Litecoin is presently trading down 3.06% at $5.214.
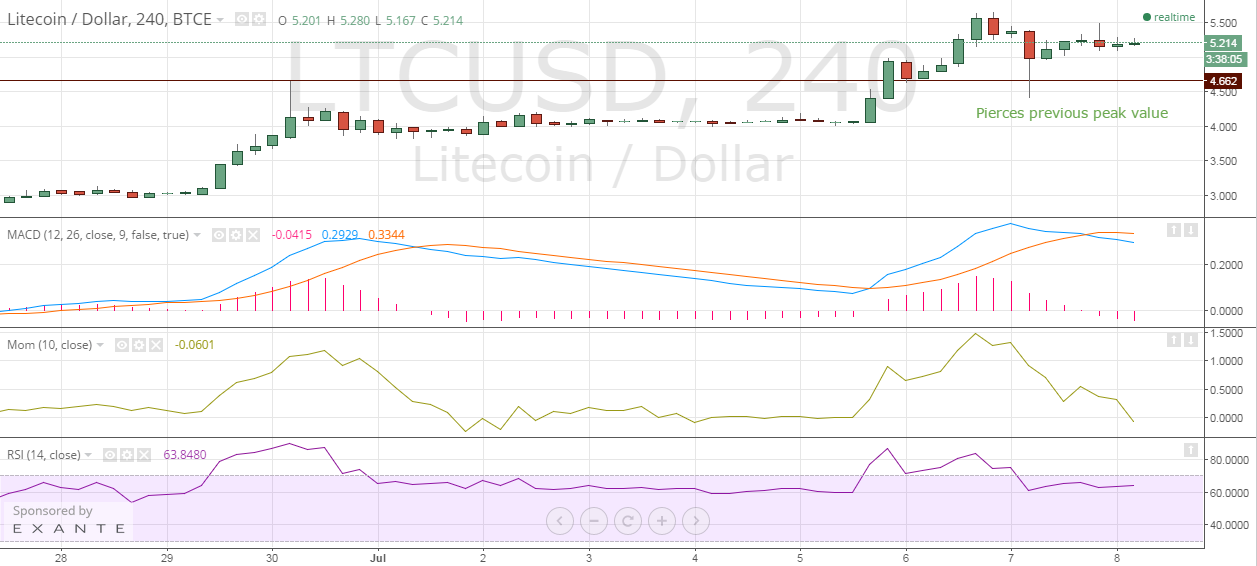
Looking at the 240-minute LTC-USD price chart, I can say that technical indicators are currently giving conflicting signals while the chart structure remains firm.
Litecoin Chart Structure – At one point of time, Litecoin was down 18% from our previous observation of $5.379 to $4.412 before it quickly trimmed the losses. As the buyers bought on the dip, the price was once again elevated to $5.495, at which it started witnessing profit booking once again.
It must also be noted that during the collapse, Litecoin pierced the previous peak of $4.670.
Moving Average Convergence Divergence – The negative crossover of MACD with Signal Line indicates bearish price action for the future sessions. The MACD now has a value of 0.2929 while the Signal Line has a value of 0.3344. This has pressed the Histogram into the sub-zero region with a value of -0.0415.
Momentum – The Momentum indicator reading has undergone a deep cut. From yesterday’s highly encouraging value of 1.2939, the value has declined to a disappointing -0.0601.
Relative Strength Index – Contrary to MACD and Momentum, Litecoin continues to display remarkable strength. It has been 9 straight sessions when the RSI value has stayed above the 60-mark. The latest 14-4h RSI value is 63.8480.
Conclusion
Litecoin is maintaining its expensive valuations comfortably, supported by strong underlying strength. Mixed technical signals do not help the traders. I would suggest that market participants adopt a cautious approach and trade lightly. Look to short on higher levels but do not buy.