

Key Highlights
- Litecoin price yesterday passed a crucial test, survived a major support area and currently attempting to move higher.
- It looks like the price broke a major triangle pattern on the 2-hours chart with data feed from HitBTC, which may take it towards the 100 simple moving average.
- On the flipside, there is a support trend line break noted on the 30-min chart (data feed via Bitfinex), which is a bearish sign.
Litecoin price may trade higher, and if buyers succeed in taking control, then there is a chance of it testing the 100 simple moving average (2-hours).
Buy or Sell?
If we first look at the lower time frame chart of Litecoin price like the 30-mins chart (data feed via Bitfinex), then there is a bearish sign already. Yesterday, I highlighted a bearish trend line on the same chart, and pointed that it may act as a hurdle for buyers in the short term. The price did climb higher, but it found resistance around the same trend line. There was a downside move later on that took the price a few points lower. There was another bullish trend line formed on the 30-mins chart (data feed via Bitfinex), which was broken during the downside reaction.


However, the downside break does not look convincing, and the price may head back higher. On the upside, the bearish trend line may still come into play, and as long as the price is below it there are no chances of gains. The 100 simple moving average on the 30-min chart (data feed via Bitfinex) is also aligned just below the same bearish trend line. And, the 50% Fib retracement level of the last leg down from the $3.10 high to $3.00 low is positioned near the 100 MA to act as a barrier. Only a break above the highlighted trend line and resistance area could take the price higher and negate the bearish view. On the downside, if the recent trend line break is real, then move towards the $3.00 support area is possible in the short term.
Looking the 2-hours chart with the data feed from HitBTC there is a different picture altogether. There was an interesting triangle pattern formed, which was breached by buyers to take the price higher. The price cleared the triangle resistance trend line and currently trading near the 23.6% Fib retracement level of the last drop from the $3.40 high to $3.072 low. We need to see if the recent break is real or false like the previous one.
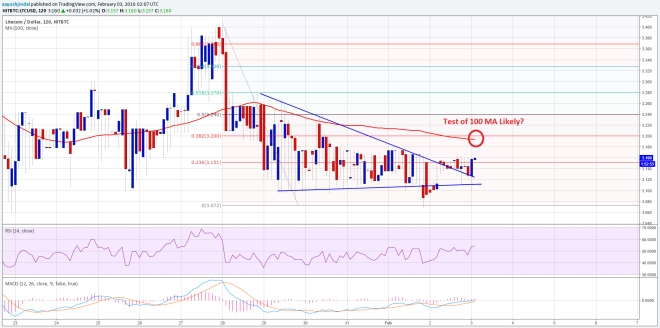
If the bulls succeed in taking the price higher, then the next hurdle for them could be around the 100 simple moving average (4-hours chart with data feed from HitBTC). The stated MA is positioned with the 38.2% Fib retracement level of the last drop from the $3.40 high to $3.072 low, which may stall gains moving ahead.
Looking at the indicators:
2-hours MACD – The MACD is in the bullish zone, which is a positive sign.
2-hours RSI – The RSI is above the 50 level, which is another bullish sign.
Intraday Support Level (HitBTC) – $3.05
Intraday Resistance Level (HitBTC) – $3.20
Charts from Bitfinex and HitBTC; hosted by Trading View