

Key Highlights
- After trading in a tiny range this past week, Litecoin prices traded higher, and currently look set for more upsides.
- A contracting triangle pattern was formed on the hourly chart (price feed from Bitfinex), which was breached to open the doors for buyers to take the price higher.
- A move back towards the last swing high of $3.80-85 is possible in the short term.
After a sharp decline towards $3.20, Litecoin’s price found support and is currently positioning itself for more gains.
100 MA (4-hours) as Pivot
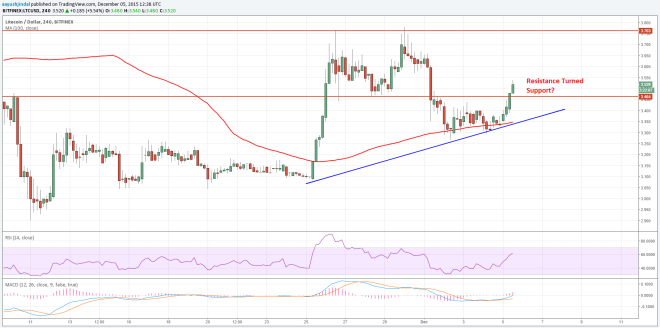

This past week, there was a nasty fall in Litecoin’a price that took it towards the $3.30-20 support area. However, there were bids noted around the stated level, which helped the price to recover some ground. Currently, there is a bullish trend line formed on the 4-hour chart (data feed from Bitfinex), which is acting as support for a move higher. The 100 simple moving average (4H) is also positioned with the highlighted trend line to act as a hurdle for sellers.
The price closed the week above a major resistance area of $3.45, which may now act as a support if the price corrects lower from the current levels. The next level of interest on the upside is around the last swing high at $3.75-80, where sellers may appear once again.
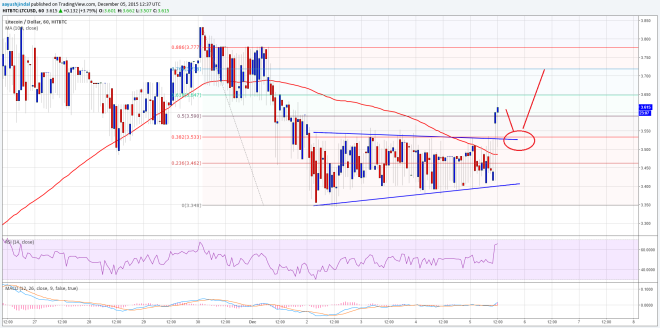
Moreover, there was a contracting range formed on the hourly chart (data feed from HitBTC), which was also broken. The recent moves clearly suggest that buyers are stepping in, and might take the price higher in the short term. On the downside, $3.40-50 can be seen as a support area.
Looking at the indicators:
4H MACD – The 4-hours MACD is in the bullish zone, calling for more gains.
4H RSI – The 4-hours RSI is above the 50 level, which is another sign of buyers in action.
Intraday Support Level – $3.40
Intraday Resistance Level – $3.75
Charts from Bitfinex and HitBTC; hosted by Trading View