Litecoin price started last week by dropping from around $2.2 to $1.66, yet the momentum of the market changed as it started rising up again on the 1st of February. It’s quite obvious how litecoin has been exhibiting a rather long bearish wave since it reached $48, its all-time high recorded back in 2013.
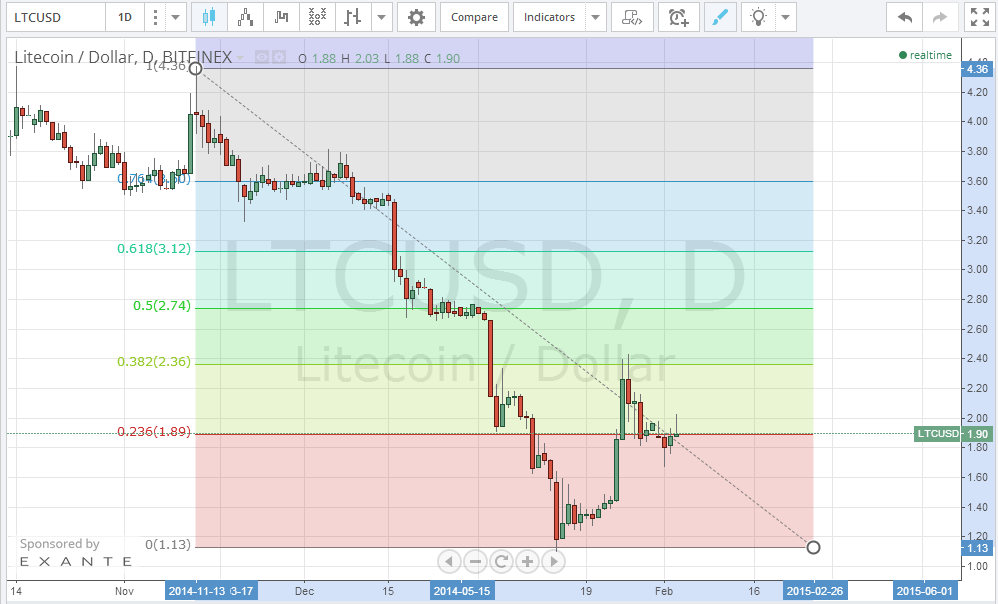
To identify current resistance and support levels, we will draw a trend line between the high reached on the 13th of November, 2014 ($4.36) and the low reached on the 14th of January, 2015 ($1.13) and then plot the Fibonacci retracement accordingly on the 1 day Bitfinex (LTC/USD) charts from tradingview.com (look at the below chart). We can now clearly spot a downtrend starting on the 13th of November, 2014 that has reversed on the 14th of January. It is also obvious that the new bullish trend was resisted by the 38% Fibonacci retracement level leading to a downward correction that drove the price down to the 23% Fibonacci retracement level. This week started by a rise in Litecoin price starting after it touched the 23% resistance level.
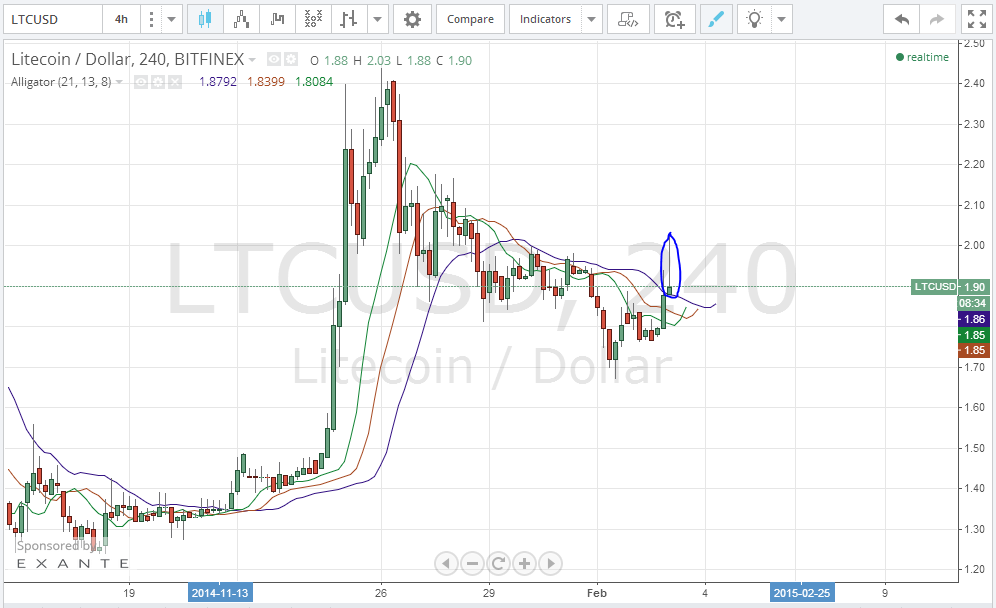
By plotting William’s Alligator on the 4 hour Bitfinex (BTC/USD) charts, we can see that the price is now above the three moving averages of the alligator (look at the candle in the blue cloud on the below chart) and we can also spot the green moving average crossing above the red moving average; accordingly, conditions are in favor of continuation of the bullish wave so that it would test the $2.4 resistance level soon.
Litecoin Price Weekly Analysis Conclusion
Litecoin price bearish wave was reversed at the end of last week. Analysis predicts the price will continue rising this week to test the $2.4 resistance level.
Charts from Bitfinex.