

The Monero price had risen considerably during the beginning of the year, but XMR could not hold onto that price momentum. In recent times, the XMR price has been correcting itself. Over the last week, Monero dipped by 8%. On the daily chart, XMR lost 0.4% of its value.
Currently, the altcoin is consolidating under the immediate resistance mark. The technical outlook of Monero also sided with the bears as demand for the coin fell on its chart. Accumulation also declined as buying strength fell.
The altcoin is still hovering close to its immediate resistance level, but the bulls tire out every time the altcoin tries to breach the immediate price ceiling. For the broader market to gain strength, Bitcoin has to start recovering on its chart.
The bulls could be back, as indicated by the golden cross on the daily chart. The market capitalization of Monero fell, which indicated sellers were starting to take over the price at the time of writing.
Monero Price Analysis: One-Day Chart

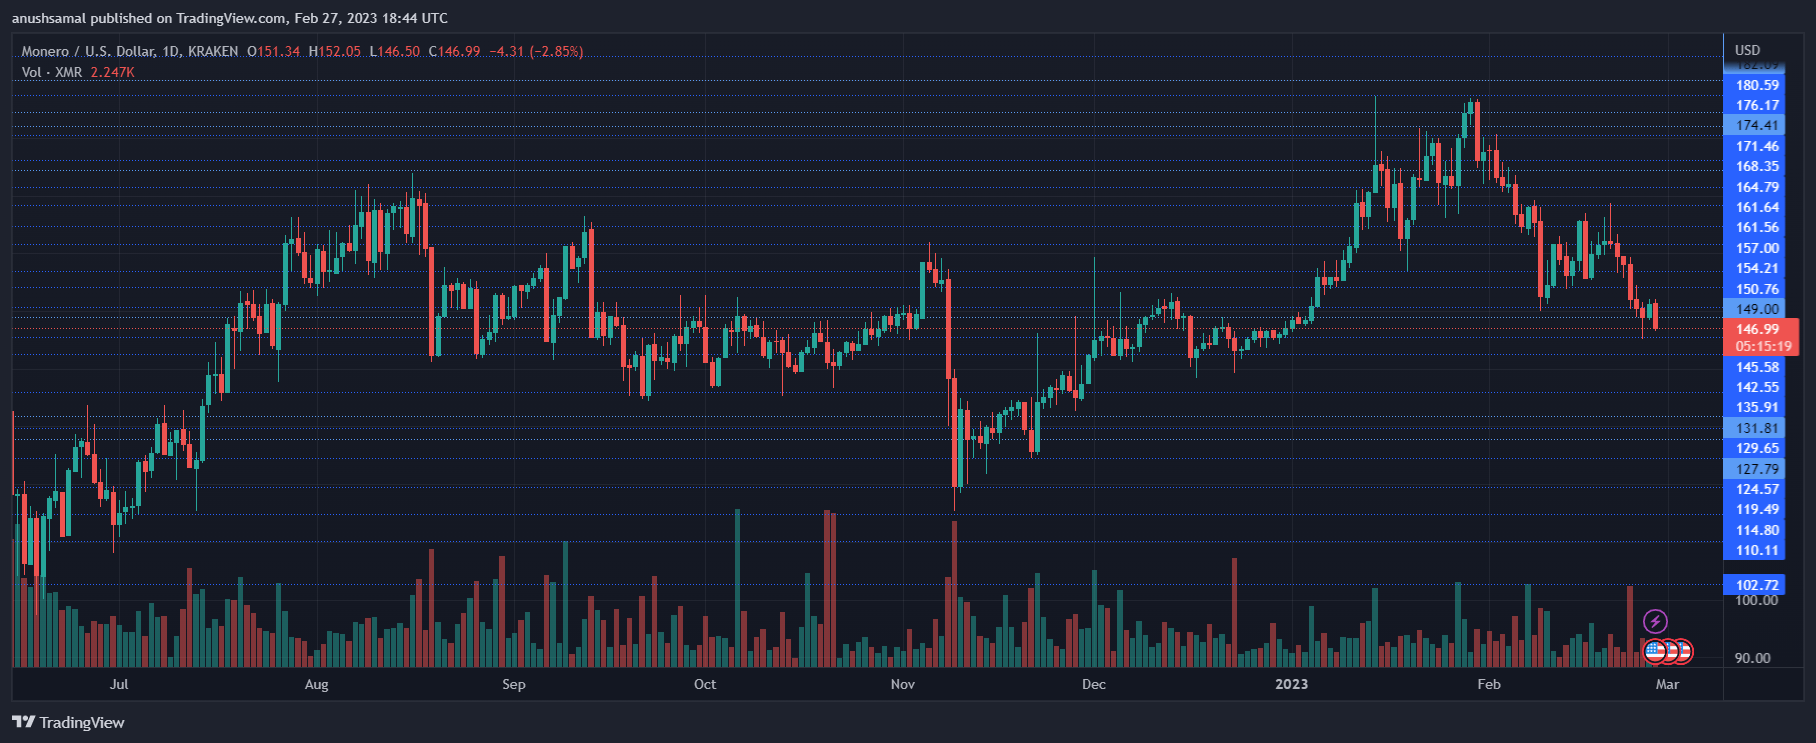
XMR was trading at $146 at press time. The altcoin has been struggling under the $150 resistance level for some time now. The coin has to move above the $150 price ceiling for the bulls to take over. Only after that can XMR begin its bullish recovery.
Monero’s local support level was $141, and a drop below that level would give the bears control of the asset’s price. The amount of XMR traded in the last session declined, indicating a fall in buying strength at press time.
Technical Analysis
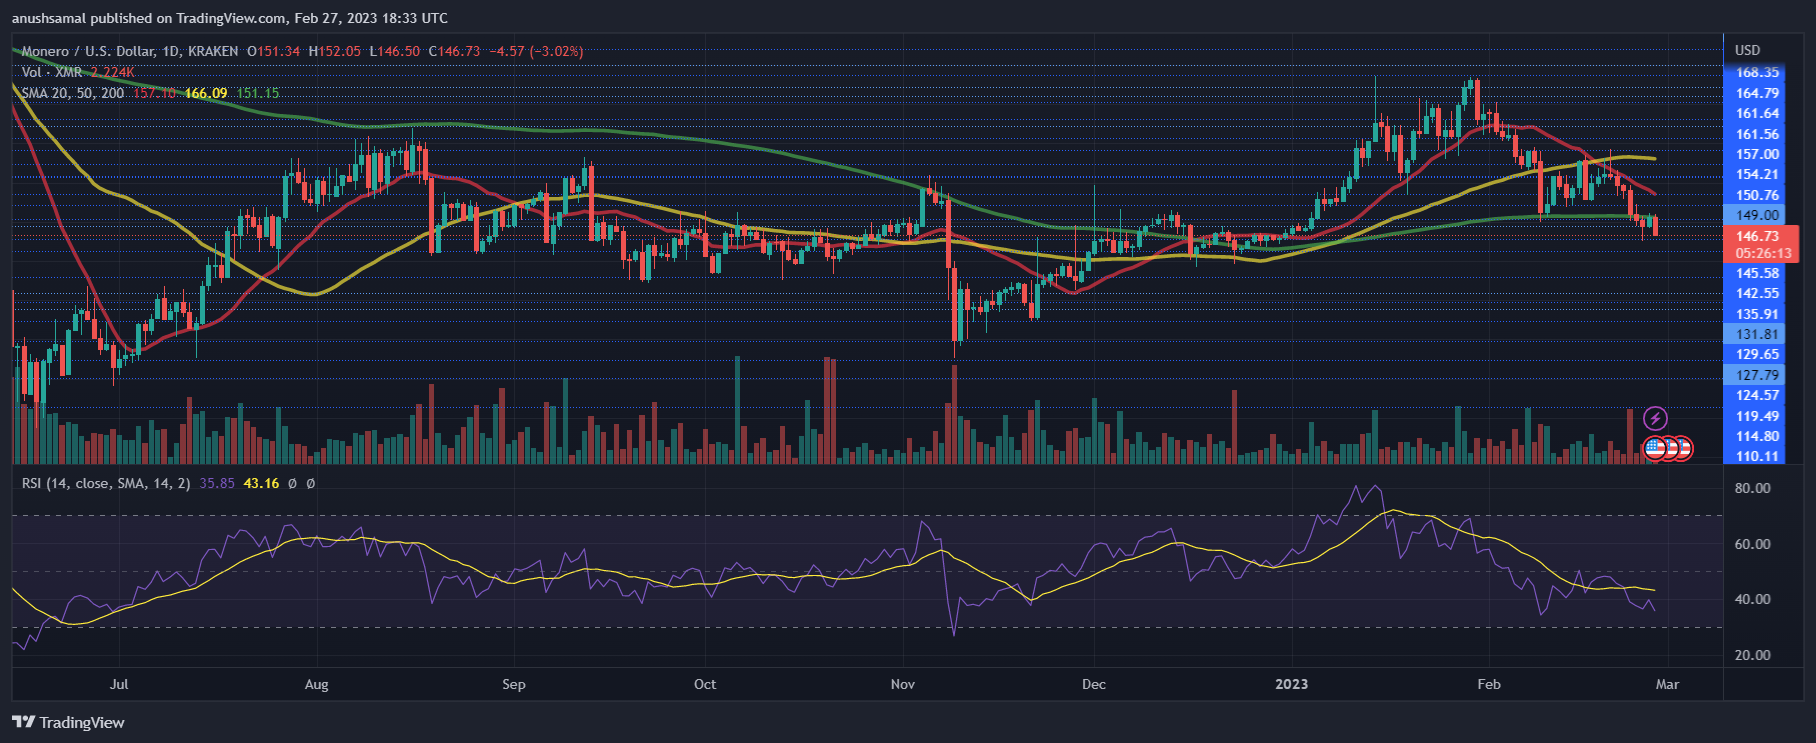
The altcoin formed a golden cross on the daily chart. A golden cross is associated with bullish price momentum in the market. It happens when the longer moving average crosses above a shorter moving average. In the case of Monero, the 50-Simple Moving Average (SMA) crossed above the 20-Simple Moving Average line.
Currently, the Monero price is below the 20-SMA as sellers are driving the price momentum in the market. The Relative Strength Index dipped below the half-line, which indicated that buying pressure had faded over the past couple of weeks.
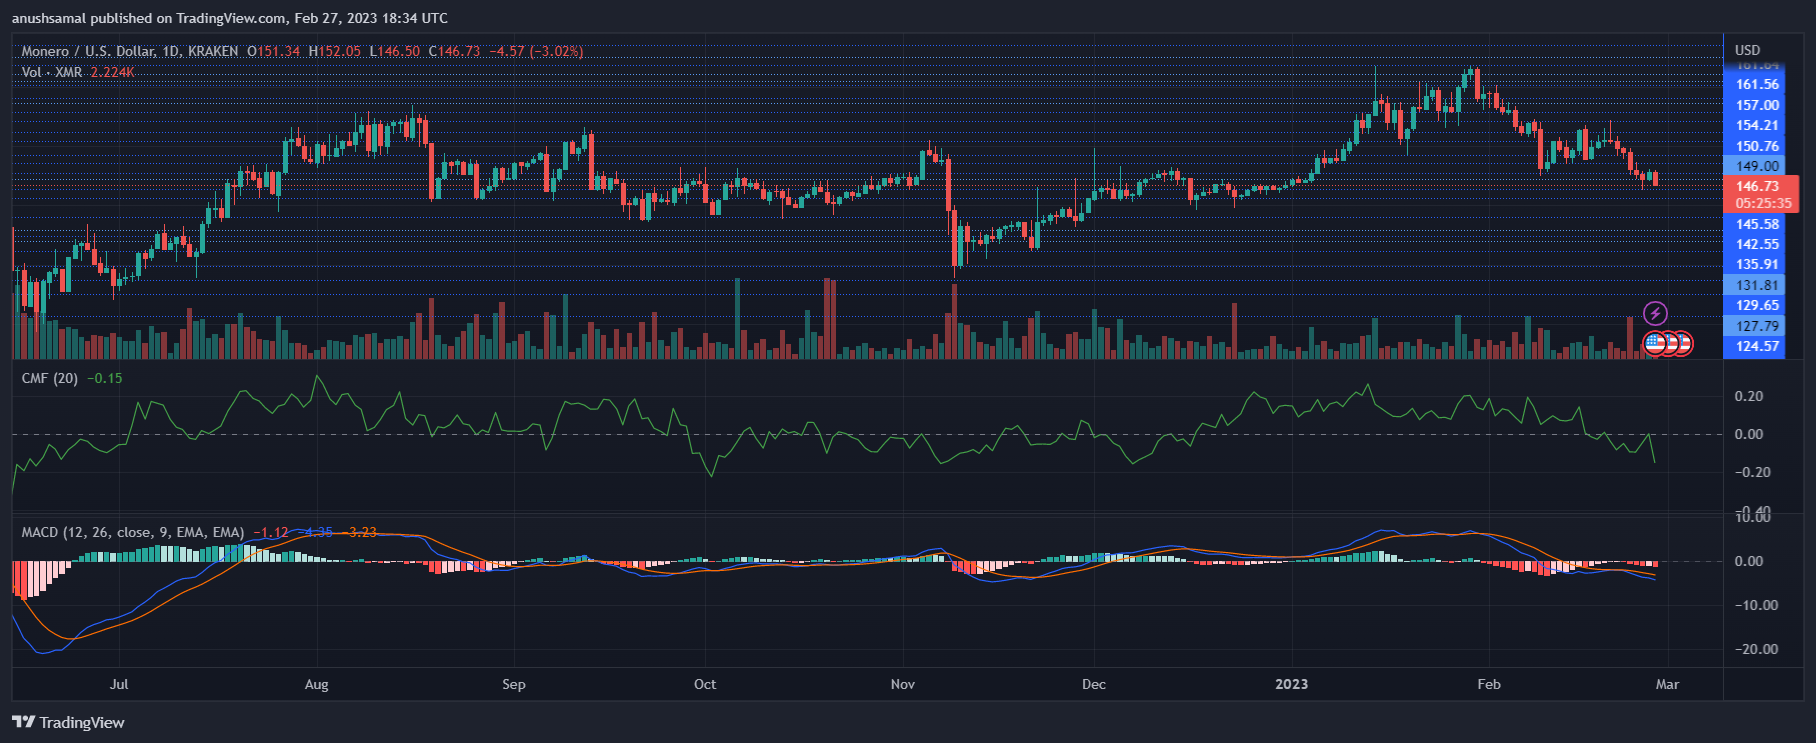
XMR depicted a sell signal on the chart as bearish pressure remained on the one-day chart. The Moving Average Convergence Divergence formed red signal bars, indicating bearish momentum and a sell signal for Monero.
The Chaikin Money Flow was also negative by other indicators. The indicator depicts capital inflows and outflows; it was below the half-line, suggesting that capital inflows fell at the time of writing.