

Bitcoin‘s halving is just one week away. The event has long been anticipated as the trigger that finally kicks off the first-ever cryptocurrency’s next major bull market – just as it has in the past.
But how does this cycle stack up to the past? With just one week to go, we’re comparing past pre-halving Bitcoin price action with the current trend, to try to make sense of it all.
T-Minus 7 Days and Counting Until the BTC Block Reward Halving
We’re just days away now from what has been anticipated to be the most bullish event to hit the cryptocurrency market over the last four years.
Bitcoin‘s halving comes at regularly scheduled intervals, roughly four years apart.
Related Reading | All Bitcoin Fundamentals Scream “Buy” Says Prominent Market Researcher
The last time the hard-coded event occurred, Bitcoin broke free from the clutches of the 2014-2015 bear market and rallied over 4,000% in the days following.
The halving before it sparked over 9,000% growth. Now that the halving is here once again, investors are expecting a similar boost.
Some of the most popular valuation models use the halving to predict significantly higher prices, but if everyone is expecting the same thing in Bitcoin, will it actually come true?
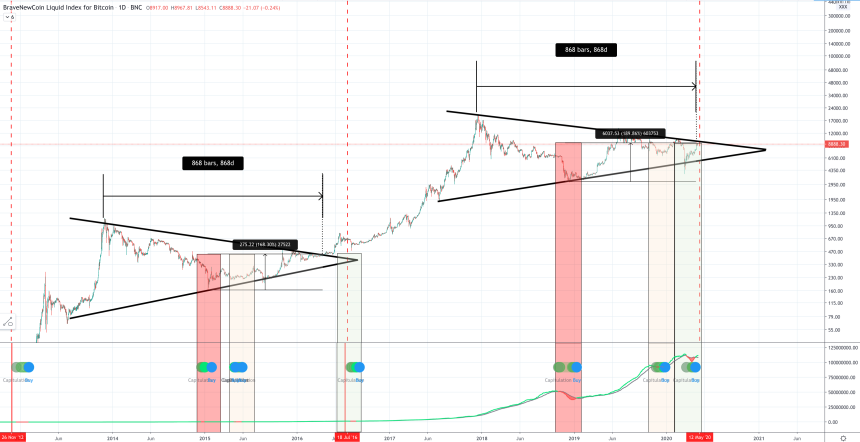

Charts courtesy of TradingView
Past Pre-Halving Bitcoin Price Action Compared
Looking back at the last halving that took place in July 2016, just prior to the event, Bitcoin broke up and retested a symmetrical triangle it traded in for the entirety of the bear market.
During the previous cycle, it took 868 days for a breakout of the asymmetrical triangle.
Comparing it to the current, cycle, Bitcoin is currently trading toward the top trend line of the current symmetrical triangle. This could indicate that a breakout is near.
Oftentimes, assets will consolidate below resistance before breaching it.
Such powerful downtrend resistance would take momentum – momentum BTC now has after touching $3,800 recently and with the halving ahead.
Each major cycle also has had three separate instances of miner capitulation, according to the Hash Ribbons indicator.
Related Reading | Massive Bitcoin Miner Capitulation Could Act As Launchpad For Bull Market
With the third, and final capitulation out of the way following the Black Thursday drop, all signs are pointing to a major Bitcoin rally in the days ahead.
Data shows that many other fundamental factors in Bitcoin are currently screaming buy, such as the asset’s hash rate reaching an all-time high.
Stimulus money is currently flooding markets, and much of it is headed into BTC.
Given the asset’s scarcity, the upcoming halving reducing that supply, and an out of control money printer that is the US government, the perfect storm for the next crypto bubble may finally be here.
Featured image from Pixabay