• Advertise
  • Submit a Press Release
NewsBTC
Bitcoin & cryptocurrency news
Crypto.com Logo
  • Home
  • News
    • Bitcoin
    • Ethereum
    • Cardano
    • Dogecoin
    • Ripple
    • DeFi
    • NFT
    • Sponsored
    • Press Releases
  • Analysis
    • Bitcoin (BTC)
    • Ethereum (ETH)
    • Cardano (ADA)
    • Chainlink (LINK)
    • Litecoin (LTC)
    • Tezos (XTZ)
    • Zcash (ZEC)
    • EOS
    • YearnFinance (YFI)
  • Trading Course
  • Directory
    • Crypto Businesses
    • Bitcoin Brokers
    • Casinos
    • Sportsbooks
  • Play GamesTry
  • Bet & WinTry
  • Bitcoin Casino ReviewsTry
No Result
View All Result
NewsBTC
No Result
View All Result
Polkadot
Nexo Logo

Polkadot At $9.30, But Is There A Chance Of Slight Shift In Trend?

anushsamal by anushsamal
2 months ago
in Cryptocurrency news
Reading Time: 2 mins read
Advertisement

Polkadot has been noting fall in price over the past few days. Although the coin has been laterally trading, there has been continuous dips in the price. Over the last 24 hours, DOT fell by 4.2% and in the last week the coin brought home minor gains.

Broader market weakness can be attributed to most altcoins either trading sideways or moving downtrend. The coin broke below its crucial support of $14 and ever since that Polkadot has been moving south.

Buying strength also automatically faded from the market as the bears took over the price action. Despite the bears strengthening, DOT continued to attempt moving on the upside but the coin was met with selling pressure each time.

5 BTC + 300 Free Spins for new players & 15 BTC + 35.000 Free Spins every month, only at mBitcasino. Play Now!

The bulls just need to push the price a little above the $9.60 mark after which the buyers could attempt to re-enter the market. This could bring in some relief to the altcoin’s price.

Polkadot Price Analysis: One Day Chart

Polkadot
Polkadot was priced at $9.30 on the one day chart | Source: DOTUSD on TradingView

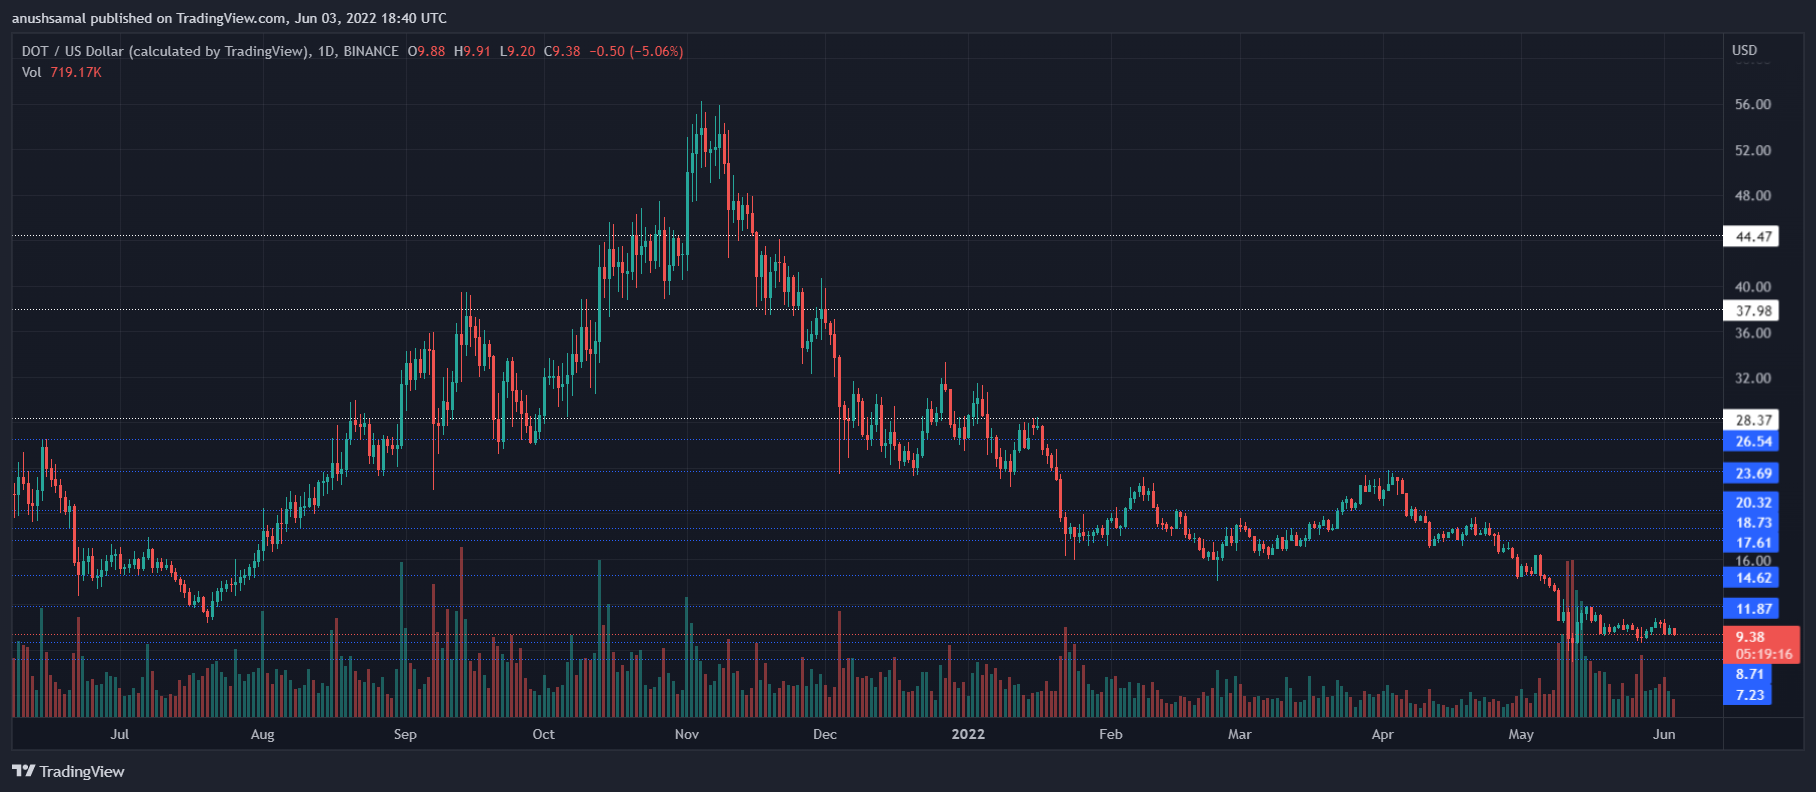
DOT was trading at $9.30 on the one day chart. Polkadot was mostly consolidating but was trying to break past the same every now and then. Bears have gotten stronger as buying strength has fallen. A fall below the $9.30 price mark will cause the coin to rest on the $8.71 support line.

This would mean DOT would touch the price level of August, 2021 again. Overhead resistance for the coin stood at $10 and a push above the same will make the altcoin trade near the $11.87 price mark.

BitStarz Player Lands $2,459,124 Record Win! Could you be next big winner?
Get 110 USDT Futures Bonus for FREE!

The volume of the coin traded had fallen and was seen in red. This indicated that the bulls had weakened at press time.

Technical Analysis

Polkadot
Polkadot registered fall in buying strength on the one day chart | Source: DOTUSD on TradingView

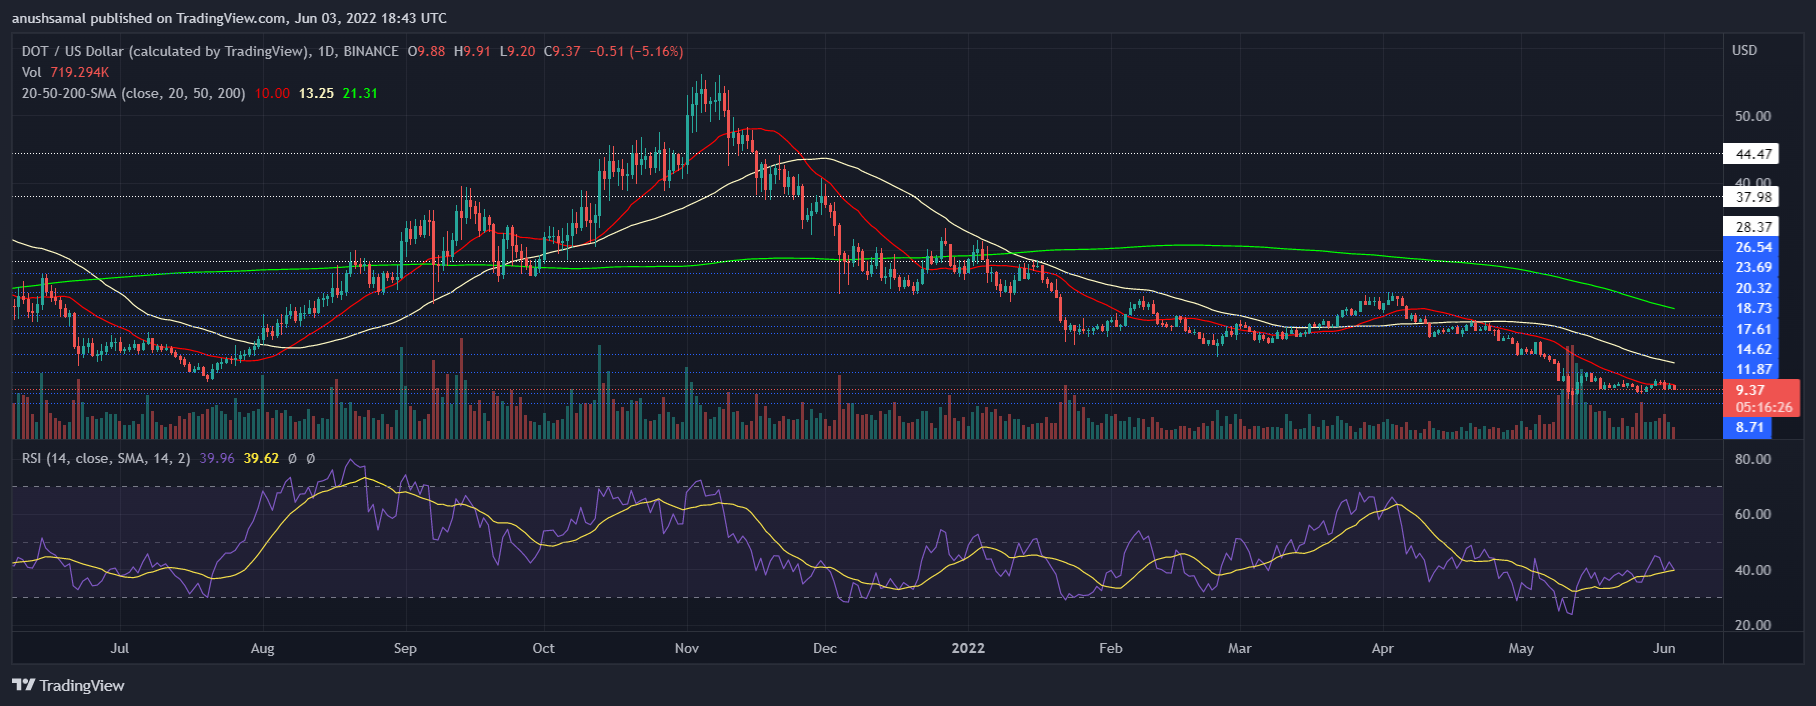
DOT noted a consistent increase in buying strength as seen on the Relative Strength Index. There has been an uptrend on the RSI. At press time, the coin displayed fall in buying strength as the indicator captured a downtick signifying increase in selling pressure.

In regards to DOT registering a shift in price action, the price pf the asset was seen slightly above the 20-SMA line. This meant that buyers were slowly gathering momentum and that the sellers might not continue to drive the price momentum in the market.

Read our comparison of 50 different crypto casinos. Find out who has most generous bonuses, best UX, knowledgeable customer support and best provably fair games.

Related Reading | Polkadot Surged Over 4%, What Are The Technicals Indicating?

Polkadot
Polkadot flashed a buy signal on the one day chart | Source: DOTUSD on TradingView

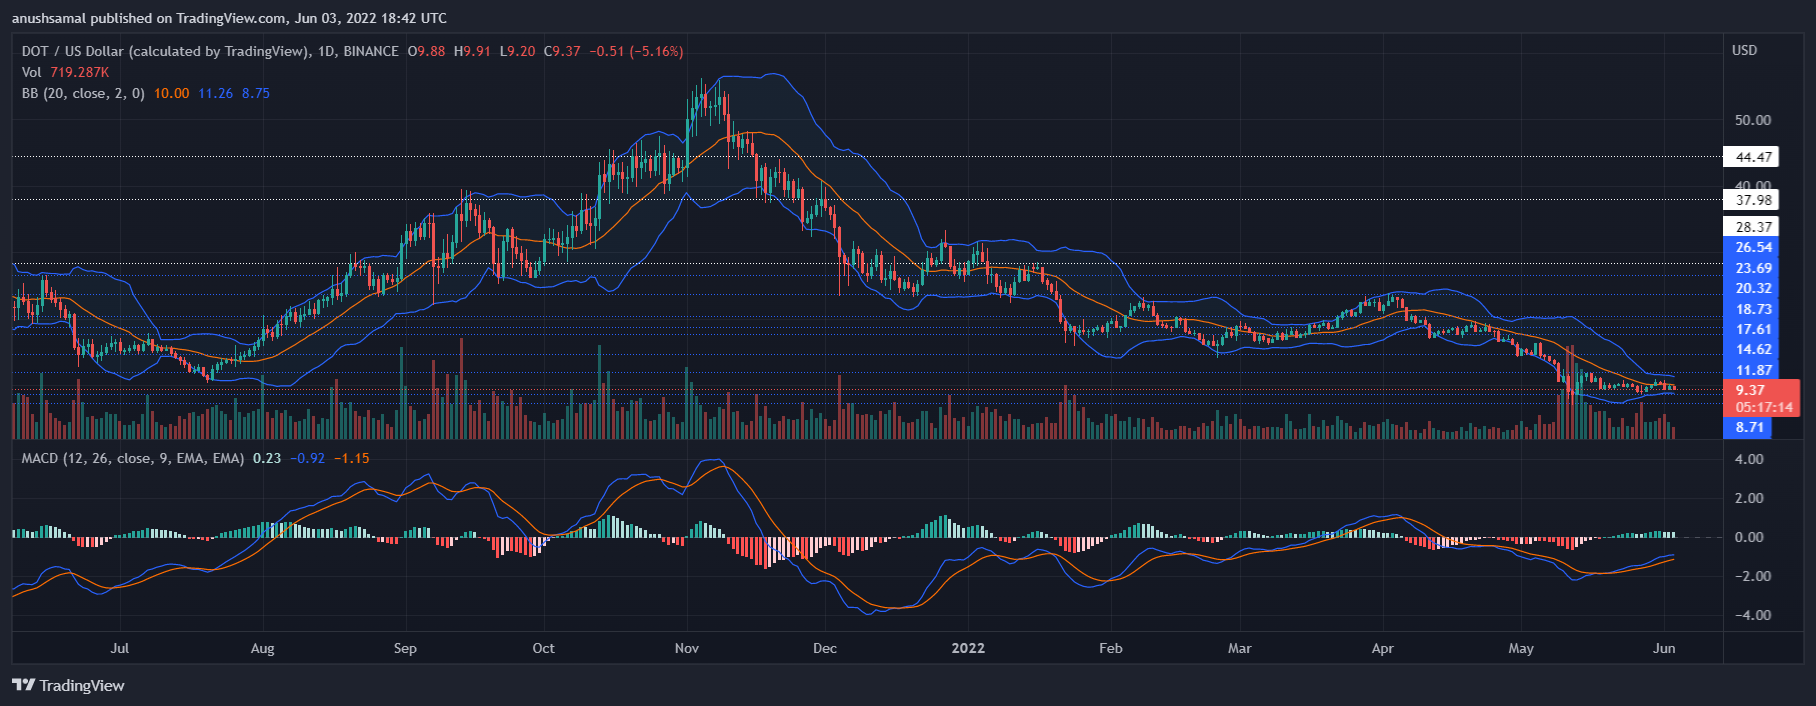
DOT flashed a buy signal which amounts to the coin displaying a possible change in the price action. Moving Average Convergence Divergence depicts the price momentum, and it indicated bullishness. MACD portrayed green signal bars which are tied to a buy signal.

Bollinger Bands that indicate price volatility showed narrowing of the bands. If the bands become narrowed it means that price volatility is about to drop.

A drop in the same means lesser price fluctuations. DOT can try to rise above the given immediate resistance if the buying strength increases in the market over the immediate trading sessions.

Related Reading | Bitcoin NUL Suggests More Downside To Come Before The Bottom

Tags: DOTpolkadotprice analysis
Tweet123Share196ShareSend
Win up to $1,000,000 in One Spin at CryptoSlots
anushsamal

anushsamal

Related Posts

Emergents TCG Officially Moves To Public Beta With The Exclusive ‘Super Booster’ Pack Flash Sale

Emergents TCG Officially Moves To Public Beta With The Exclusive ‘Super Booster’ Pack Flash Sale

2 hours ago
XRP

XRP Sluggish At Resistance – Will It Break Out After 2 Months Of Vertigo?

9 hours ago
Challenging Tiffany & Co. and What Could be the Most Expensive Public Sale in NFT History

Challenging Tiffany & Co. and What Could be the Most Expensive Public Sale in NFT History

11 hours ago
Bitcoin price

Bitcoin Price Trades A Little Over $24,000, Can It Target $27,000?

11 hours ago
Shiba Inu price

Shiba Inu Price Forms Cup And Handle Pattern, What Does This Mean?

14 hours ago
ethereum

Ethereum Hits New Milestone, Investors Accumulate Ahead Of Merge

16 hours ago

Premium Partners

Top Brokers

PrimeXBT

PrimeXBT

Review · Visit

Top Casinos

BitStarz

BitStarz

Review · Visit
7BitCasino

7BitCasino

Review · Visit
Punt Casino

Punt Casino

Review · Visit
mBit

mBit

Review · Visit
CryptoGames

CryptoGames

Review · Visit
Bspin

Bspin

Review · Visit

Sportsbooks

1xBit

1xBit

Review · Visit

Investors Should Buy These Cryptos Today: Uniglo (GLO), Bitcoin (BTC) And Fantom (FTM)

August 16, 2022

Gnox (GNOX) Causing Polygon (MATIC) And Avalanche (AVAX) Investors To Bridge Over After Presale 100% Sold

August 16, 2022

The “4 games – 1 token” project Kingdom Quest announcing IDO and Mainnet

August 16, 2022

Nukplan (NKPL) Is Now Available for Trading on LBank Exchange

August 16, 2022

Blockchain ACGN Game NEO FANTASY, Rising Star Of Gamefi!

August 16, 2022

ABOUT US

NewsBTC is a cryptocurrency news service that covers bitcoin news today, technical analysis & forecasts for bitcoin price and other altcoins. Here at NewsBTC, we are dedicated to enlightening everyone about bitcoin and other cryptocurrencies.

We cover BTC news related to bitcoin exchanges, bitcoin mining and price forecasts for various cryptocurrencies.

COMPANY

  • Advertising
  • Comments Policy
  • Privacy Center
  • Sitemap
  • About Us
  • Contact

Technical Analysis

  • Bitcoin (BTC)
  • Ethereum (ETH)
  • Ripple (XRP)
  • Chainlink (LINK)
  • Cardano (ADA)
  • Tezos (XTZ)

LINKS

Crypto Prices from Nomics

Cryptocurrency news

  • Bitcoin
  • Ethereum
  • Ripple
  • Chainlink
  • Cardano
  • EOS
  • Tezos

© 2021 NewsBTC. All Rights Reserved.

  • Home
  • News
    • Bitcoin
    • Ethereum
    • Cardano
    • Dogecoin
    • Ripple
    • DeFi
    • NFT
    • Sponsored
    • Press Releases
  • Analysis
    • Bitcoin (BTC)
    • Ethereum (ETH)
    • Cardano (ADA)
    • Chainlink (LINK)
    • Litecoin (LTC)
    • Tezos (XTZ)
    • Zcash (ZEC)
    • EOS
    • YearnFinance (YFI)
  • Trading Course
  • Directory
    • Crypto Businesses
    • Bitcoin Brokers
    • Casinos
    • Sportsbooks
  • Play Games
  • Bet & Win
  • Bitcoin Casino Reviews

© 2021 NewsBTC. All Rights Reserved.

This website uses cookies. By continuing to use this website you are giving consent to cookies being used. Visit our Privacy Center or Cookie Policy.