
Reason to trust
How Our News is Made
Strict editorial policy that focuses on accuracy, relevance, and impartiality
Ad discliamer
Morbi pretium leo et nisl aliquam mollis. Quisque arcu lorem, ultricies quis pellentesque nec, ullamcorper eu odio.
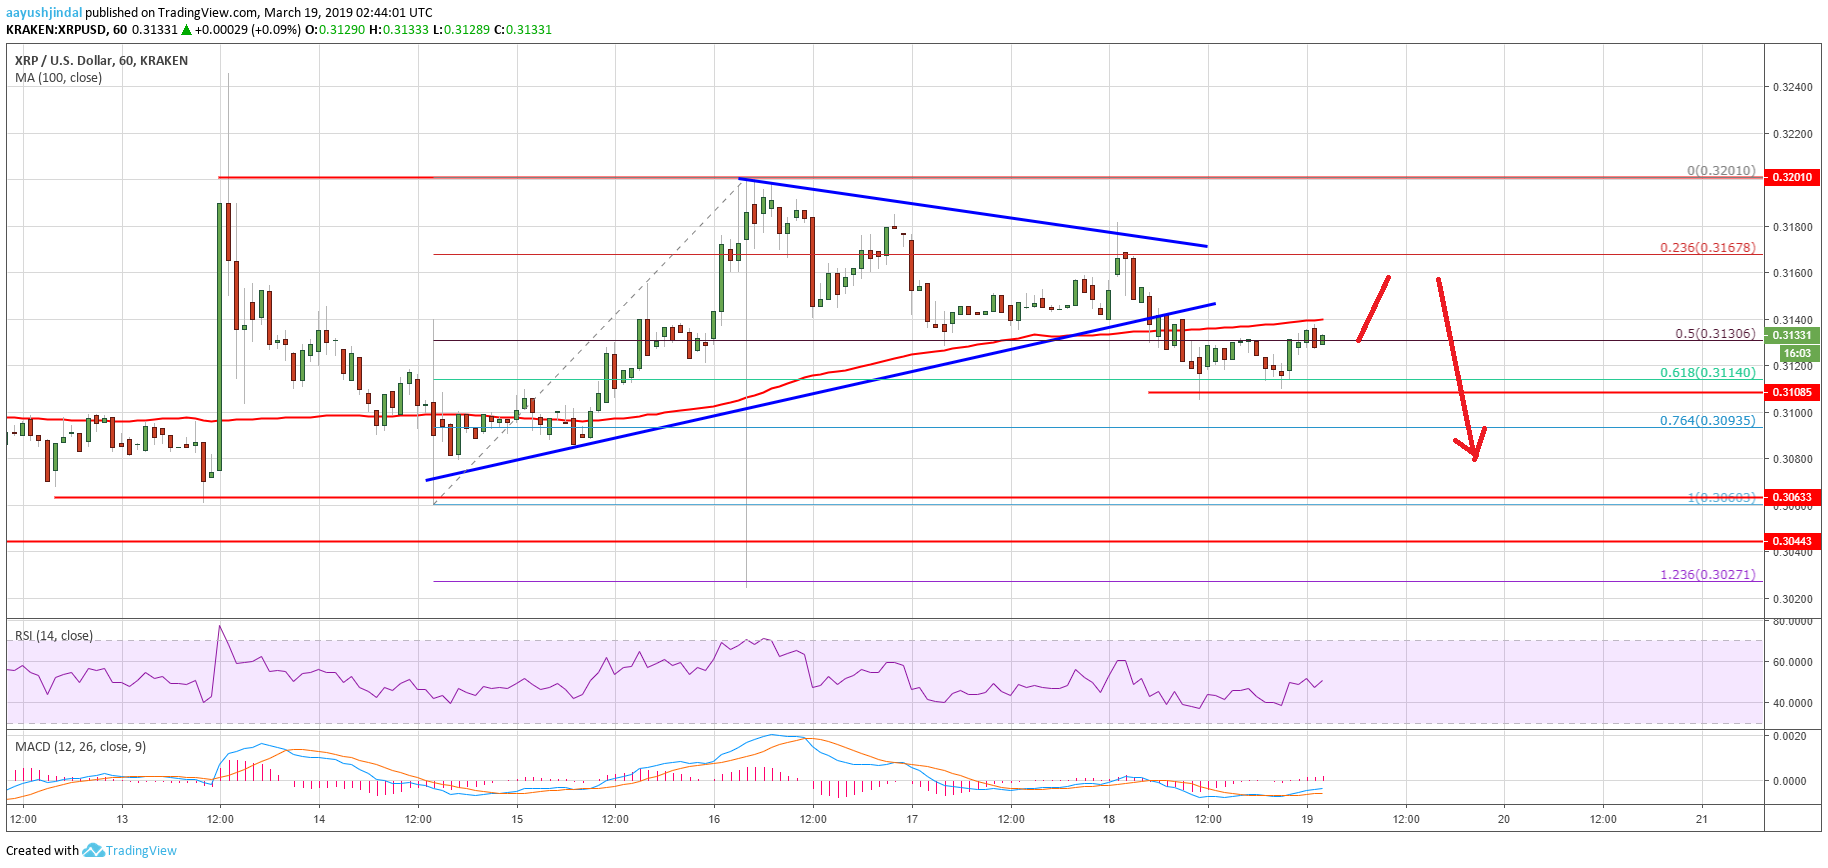
- Ripple price carved a short term top near the $0.3200 level and declined recently against the US dollar.
- The price failed to stay above the $0.3160 support and moved into a bearish zone.
- Yesterday’s highlighted key bullish trend line was breached with support at $0.3150 on the hourly chart of the XRP/USD pair (data source from Kraken).
- The pair traded below $0.3140 and it is now at a risk of more losses towards $0.3080 or $0.3060.
Ripple price failed to capitalize on recent gains against the US Dollar and bitcoin. XRP/USD broke the key $0.3160 support and it could extend the current correction towards the $0.3080 level.
Ripple Price Analysis
Yesterday, we discussed the importance of the $0.3200 resistance for ripple price against the US Dollar. The XRP/USD pair made a couple of attempts to clear the $0.3200 barrier, but it failed. Finally, there was a downside reaction and the price declined below the $0.3160 support. It traded below the 50% Fib retracement level of the last wave from the $0.3060 low to $0.3201 high. Furthermore, there was also a close below the $0.3160 support and the 100 hourly simple moving average.
More importantly, yesterday’s highlighted key bullish trend line was breached with support at $0.3150 on the hourly chart of the XRP/USD pair. The pair tested the next key support near $0.3110 and the 61.8% Fib retracement level of the last wave from the $0.3060 low to $0.3201 high. It is currently consolidating losses below $0.3150 and the 100 hourly SMA.
On the downside, an immediate support is near the $0.3110 level, below which the price is likely to slide towards $0.3080. An intermediate support is near $0.3094 and the 76.4% Fib retracement level of the last wave from the $0.3060 low to $0.3201 high. The main support on the downside is near the $0.3060 level, where buyers are likely to appear. On the upside, a convincing break above the $0.3160 level and the 100 hourly SMA may reduce the current bearish pressure.
Looking at the chart, ripple price is slowly moving into a bearish zone below $0.3160. However, the current wave can still be considered as a correction as long as the price stays above the $0.3060 support. On the upside, the main hurdle for buyers is near the $0.3200 level. A clear break above the $0.3200 barrier is must for upside continuation.
Technical Indicators
Hourly MACD – The MACD for XRP/USD is slowly moving in the bullish zone.
Hourly RSI (Relative Strength Index) – The RSI for XRP/USD recovered recently from 40 and tested the 50 level.
Major Support Levels – $0.3110, $0.3080 and $0.3060.
Major Resistance Levels – $0.3160, $0.3180 and $0.3200.


