

Key Highlights
- Ripple price declined recently and moved below the $0.2060 support area against the US Dollar.
- There are two bearish trend lines forming with resistance at $0.2030 on the hourly chart of the XRP/USD pair (data source from Kraken).
- The price is currently correcting higher, but it is facing many resistances near $0.2060.
Ripple price declined recently against the US Dollar and Bitcoin. XRP/USD is now below $0.2060 and struggling to recover in the short term.
Ripple Price Resistance
There was a decent upside move in Ripple price above $0.2200 this past week against the US Dollar. The price traded as high as $0.2240 before it started a downside move. It declined sharply and moved below the $0.2100 and $0.2060 support levels to settle below the 100 hourly simple moving average. It even broke the $0.1960 support area and traded as low as $0.1896.
A recovery was initiated later, which took the price above the $0.1970 level. XRP also moved above the 23.6% Fib retracement level of the last decline from the $0.2240 high to $0.1896 low. On the upside, there are two bearish trend lines forming with resistance at $0.2030 on the hourly chart of the XRP/USD pair. The $0.2030 resistance is also near the 50% Fib retracement level of the last decline from the $0.2240 high to $0.1896 low. Therefore, a close above the $0.2030 and $0.2060 resistance levels won’t be easy in the near term.
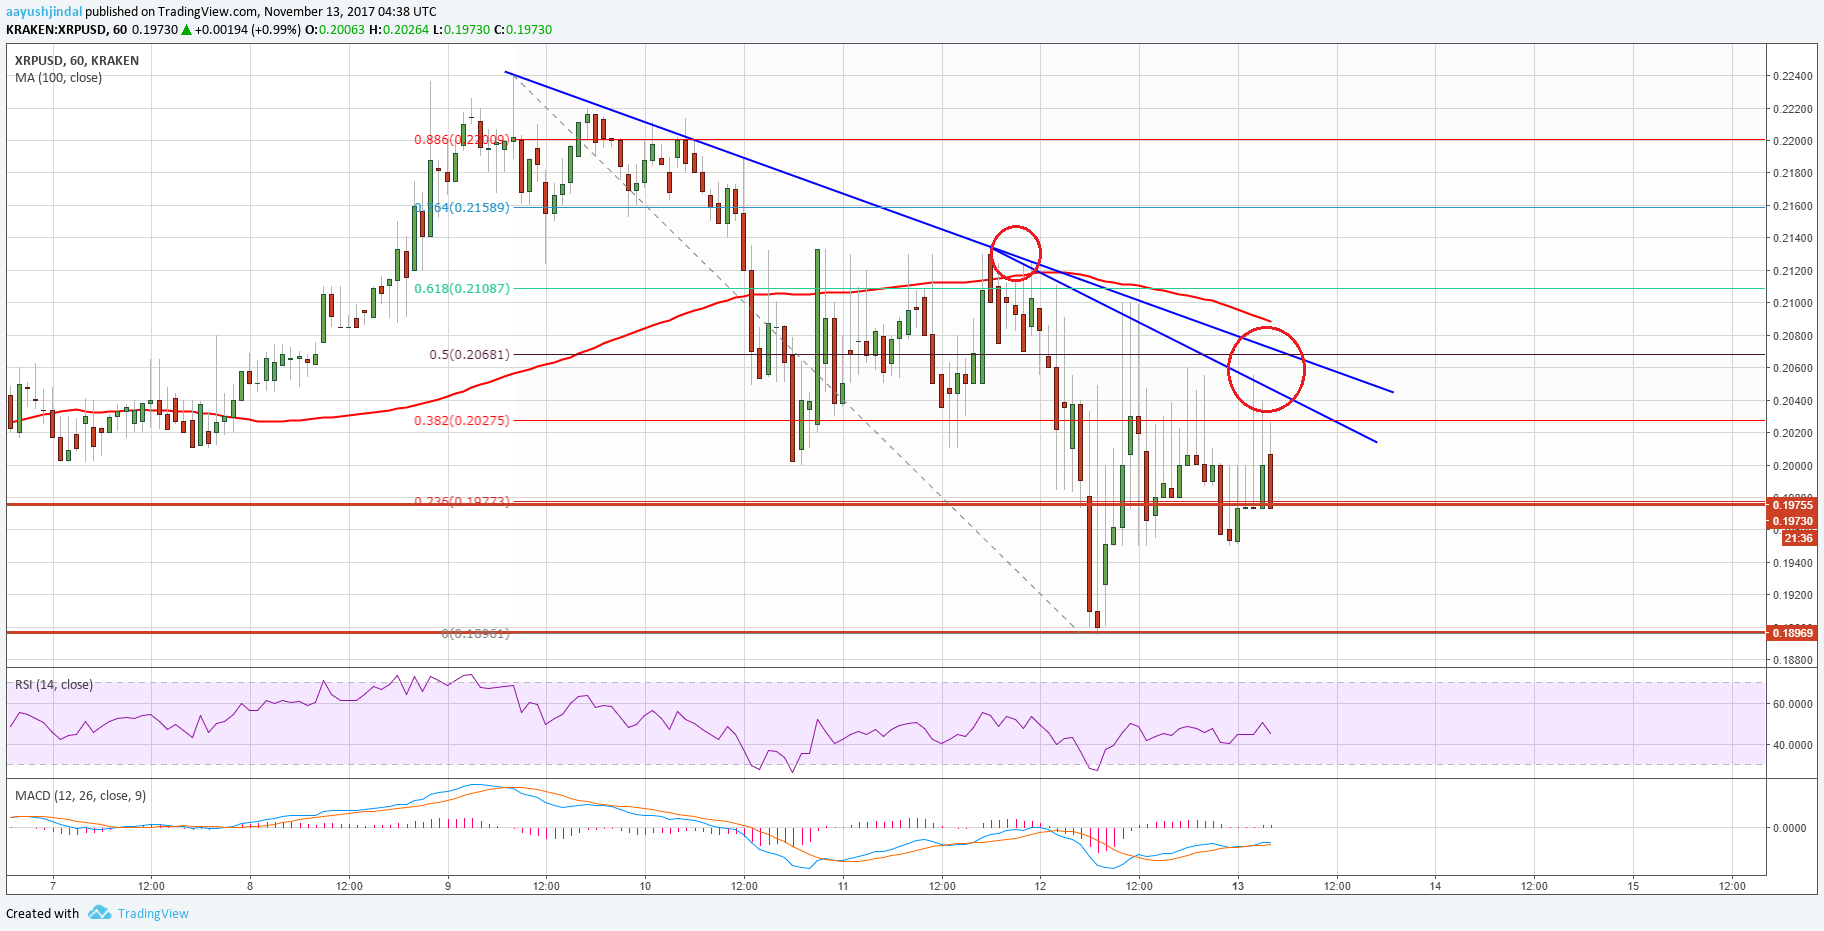
On the downside, the $0.1900 level is a decent support. Below $0.1900, the recent low near $1896 might provide support. The overall trend is neutral with chances of a dip back toward the $0.1900 level in the near term.
Looking at the technical indicators:
Hourly MACD – The MACD for XRP/USD is attempting to move back in the bullish zone.
Hourly RSI (Relative Strength Index) – The RSI for XRP/USD is above the 50 level and heading higher.
Major Support Level – $0.2180
Major Resistance Level – $0.2250
Charts courtesy – Trading View, Kraken